
Key Insights
- London traffic data statistics show that the daily cycle journeys in London reached an estimated 1.33 million in 2024.
- Based on data from the Travel in London 2024 report, the number of people cycling at least once a year hit 2.17 million in 2022/2023 before tapering off to 2.06 million.
- London has the highest rate of cycling injuries compared to other cities in the UK, with a total of 47,909, according to data from Cycling Injury Legal.
Londoners are relying on cycling as a sustainable and affordable mode of transportation.
London traffic data statistics show that the daily cycle journeys in London reached an estimated 1.33 million in 2024. This was a 5% increase from the 1.26 million in 2023 and a 26% rise since 2019.
Reports reveal that central London had the most significant growth, with an 11.6% increase between 2023 and 2024. Inner London saw a 4.2% increase, while outer London had a 3.8% increase.
The cycling demand in London
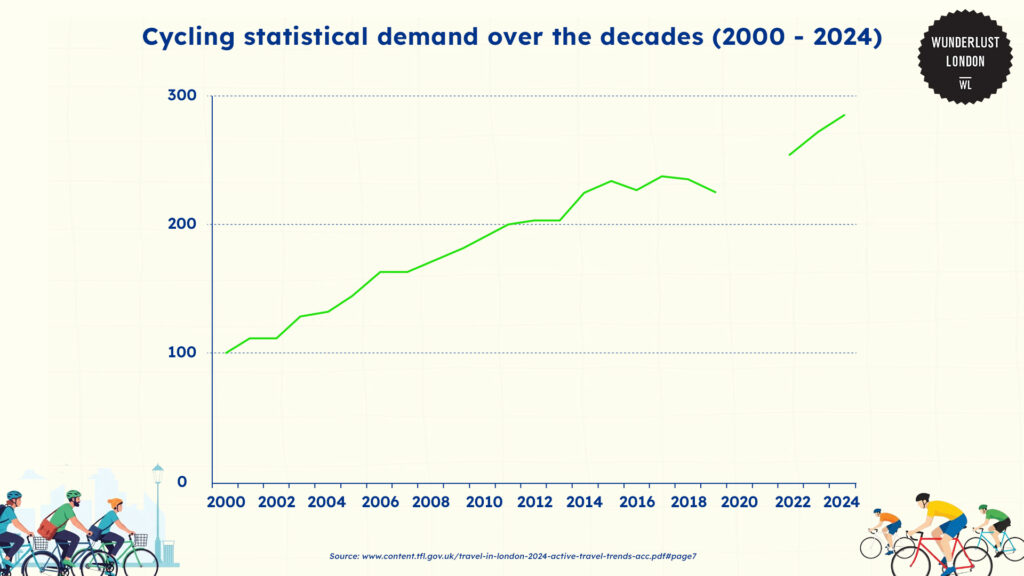
According to Transport for London, cycling journey stages increased in London between 2000 and 2024. The cycling journey stages refer to the number of daily cycle trips in London that people make.
The line went from 100 cycling stages in 2000 to almost 300 cycling stages in 2024. That’s almost three times more cycling journey stages since the start of the century.
There was an upward trend from 2000 to around 2006; the line went up from 100 to around 160. Then, from 2006 to around 2014, it showed steady growth. It even went over 220.
Between 2014 and 2022, the graph shows some wobbles, with the line between 220 and 240.
But the biggest jump in cycling is in the period leading up to 2024. The line went from around 230 in 2022 to almost 300 in 2024.
The threefold growth in cycling in London from 2000 to 2024 shows how cycling is becoming increasingly popular and important in the city.
London’s cycling network in 2024
According to Transport for London, the UK government rolled out 20 brand new Cycleway routes in 2023/24.
By September 2024, they had significantly boosted the strategic cycle network from 90km in 2016 to more than 400km. This ensured that 27.4% of Londoners are now just 400 meters away from a cycle route.
To get a glimpse of the cycling networks in London, the map below shows the geographical distribution of cycle routes as of September 2024, with the addition of new cycleways to the existing strategic network.
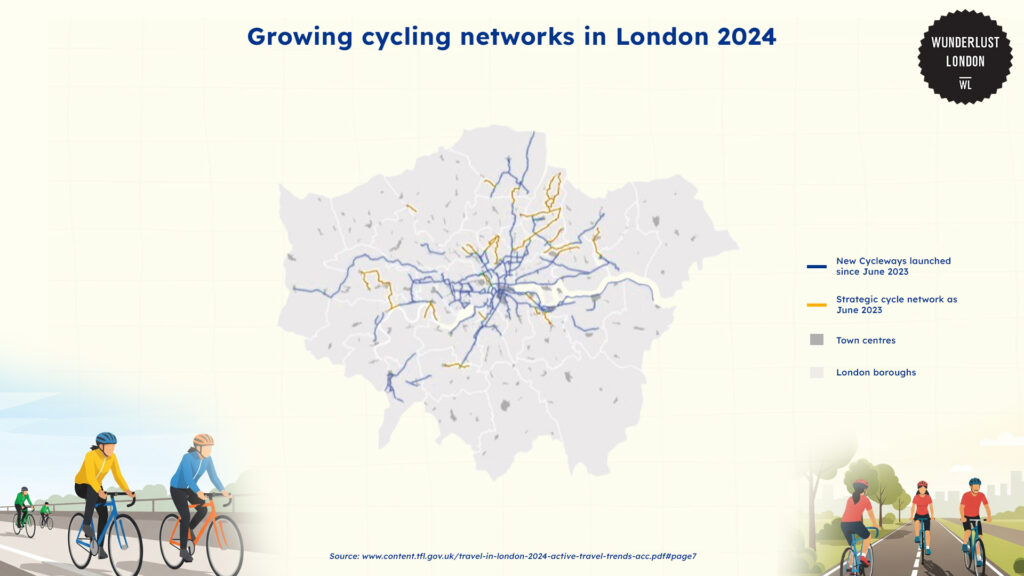
The green lines represent the established strategic cycle network from June 2023.
These routes are longer and more direct cycling journeys across London.
The red lines are the new cycleways that were launched between June 2023 and September 2024. The grey shaded areas represent different London boroughs, and the darker grey dots indicate the locations of town centers within these boroughs.
London’s regional cycling statistics
Cycling average statistics by area in London
According to data from the Travel in London 2024 report, cycling experienced a strong resurgence and sustained growth after COVID-19.
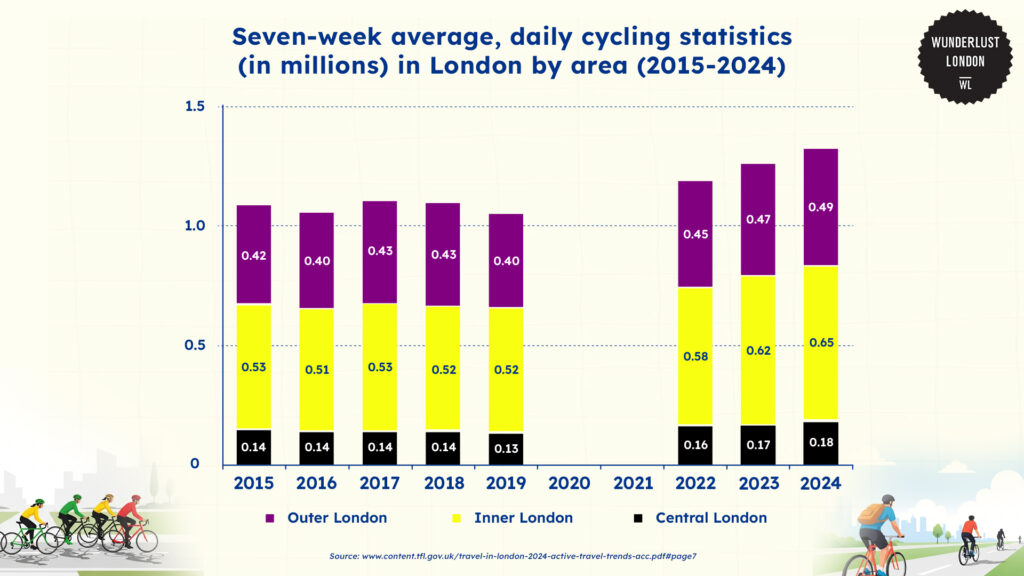
Data from Transport for London shows that daily cycle stages in London have increased since 2022. In 2015, the total daily cycle stages were approximately 140,000 in Central London, 530,000 in Inner London, and 420,000 in Outer London.
By 2024, this total grew to 1.33 million. There were 180,000 in Central London, 650,000 in Inner London, and 490,000 in Outer London.
Throughout this period, Inner London consistently accounts for the largest share of daily cycle stages.
Outer London also shows an increase in cycling, especially in recent years. The most significant jump appears between 2021 (400,000) and 2022 (450,000).
London’s cycling statistics by boroughs
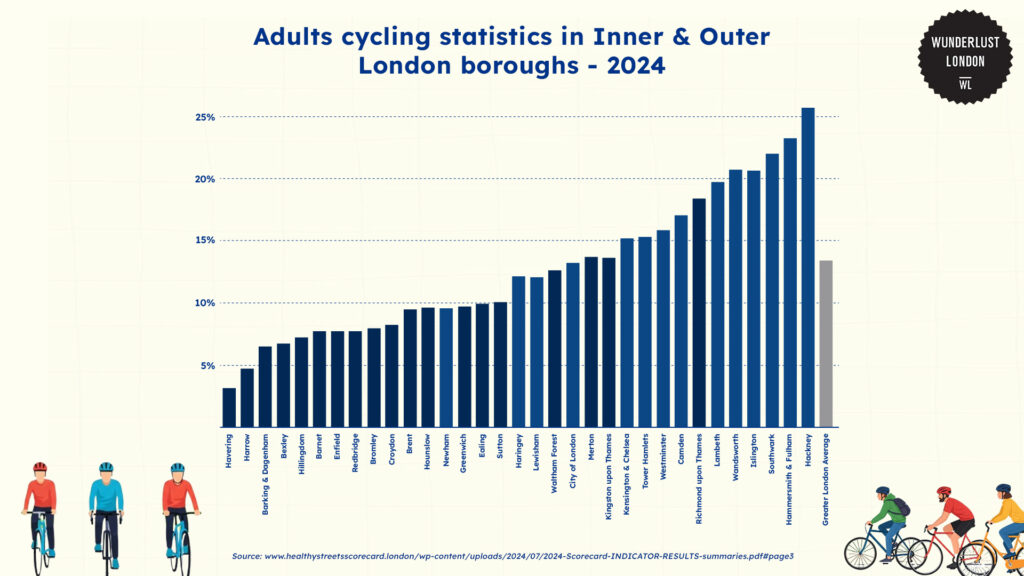
The data from the Healthy Streets 2024 Scorecard clearly shows how many adults in each London borough cycled at least once a week from 2020 to 2022.
The average cycling rate for Greater London is roughly 13%. Many of the Inner London boroughs surpass this average, while most of the Outer London boroughs tend to fall short.
Hackney takes the lead with an impressive rate of about 26%. Islington isn’t far behind, sitting at around 23%, while both Southwark and Hammersmith & Fulham come in with rates close to 21%.
On the flip side, Havering has the lowest cycling rate, at just under 4%. Other boroughs that don’t cycle as much include Harrow (around 6%), Bexley (about 7%), and Barking & Dagenham (also around 7%).
London’s cycling demographic statistics
Cycling statistics by frequency of London’s residents
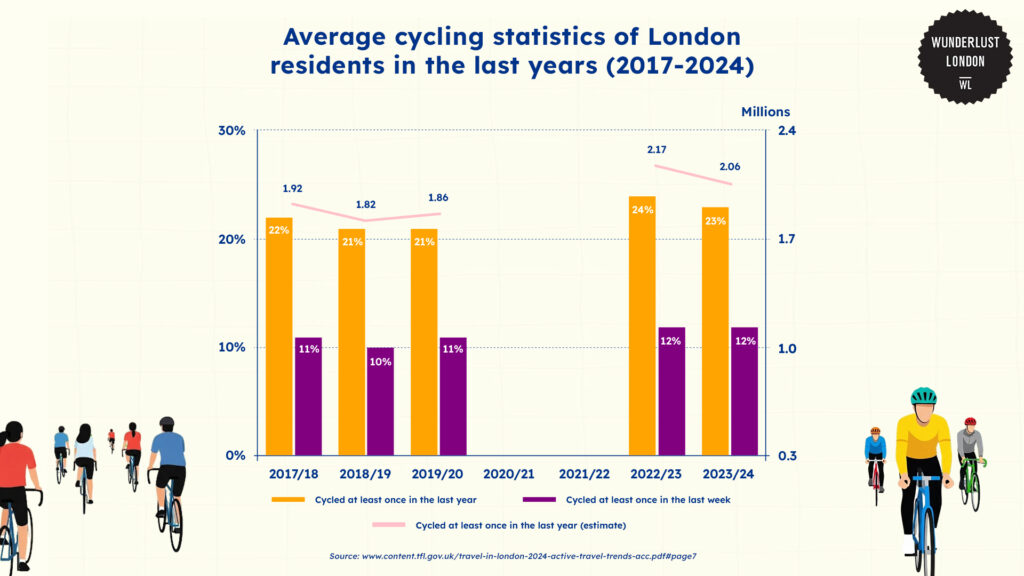
Based on data from the Travel in London 2024 report, the number of people cycling at least once a year hit 2.17 million in 2022/2023 before tapering off to 2.06 million.
The percentage of London residents who hopped on a bike at least once in the past year stays around the low to mid-twenties. It was 22% in 2017/18, increased to 24% in 2022/23, and then dipped slightly to 23% in 2023/24.
While about a fifth to a quarter of Londoners cycle at least once a year, only a smaller slice (around 10-12%) manage to cycle at least once a week. The percentage ranges from 11% in 2017/18 to 12% in 2022/23, with a slight drop to 10% in 2018/19.
The estimated number of London residents who cycled at least once started at 1.92 million in 2017/18, fell to 1.82 million in 2018/19, and then rose to 1.86 million in 2019/20.
There was a significant leap to 2.17 million in 2022/23, followed by a slight decline to 2.06 million in 2023/24.
Cycling statistics in London by sociodemographic groups
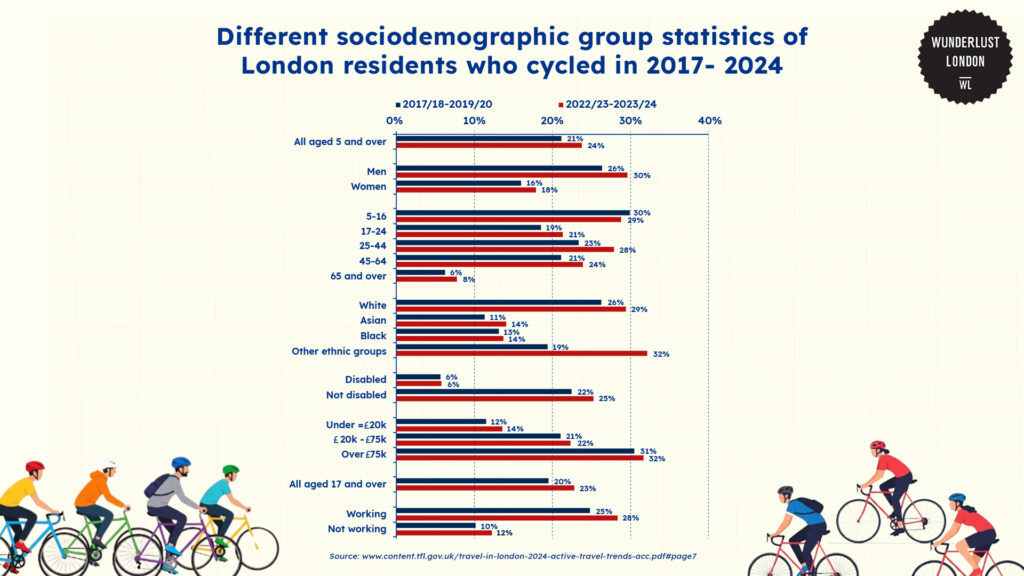
The data from the travel report shows us different socio demographic groups of Londoners and how their cycling rates changed over time.
The general average of people 5+ and older who cycled at least once a year increased 3% from 21% in 2017 to 24% in 2024.
Starting with the percentage of men and women, men cycled more at 30% in the years of 2023/204 compared to women with a rate of 18%.
The travel report also breaks down the data by ethnicity. The White ethnic group has a strong cycling rate, increasing from 26% to 29%.
The Asian ethnic group saw a modest rise from 11% to 14%. The Black ethnic group experienced a slight increase from 13% to 14%. Other ethnic groups increased from 19% to 32%.
Even 6% of disabled individuals cycled at least once a year.
Cycling trends in London
Cycling trends by journey purpose
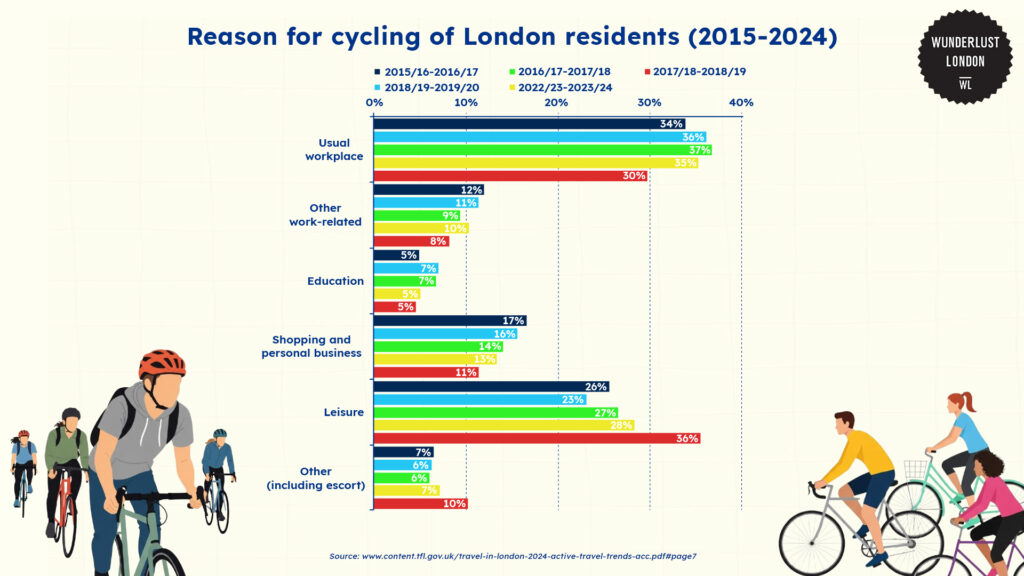
The travel London report shows that commuting to work and cycling for leisure are the main reasons for cycling trips among London residents.
The proportion of people commuting to the usual workplace has wobbled a bit over the years. It was 34% first, then 37%, and then 30% in 2023/24.
Leisure trips started at 26% in 2015 and went up to 36% in 2023/24. Shopping and personal business went down from 17% in 2015 to 11% in 2023/24.
For other work-related reasons, it was 12% then 8% in 2023/24, and for education, it was 5% and 7%
Costs and Consequences of Cycling in London
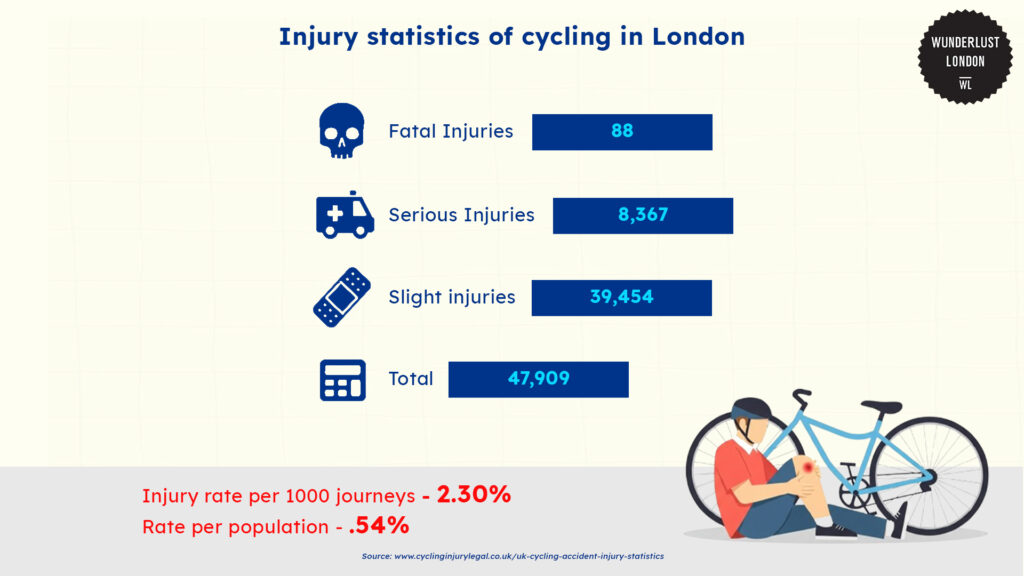
Based on data from Cycling Injury Legal, London has the highest rate of cycling injuries compared to other cities in the UK, with a total of 47,909.
When that statistic is broken down into individual injuries, London’s numbers are still high: 8,367 serious injuries and 39,454 slight injuries.
Road collision cyclist casualty statistics in London

The graph shows data taken from the Healthy Streets Scorecard for London, representing the average annual number of cyclists seriously injured or killed in road collisions for every 1,000 daily cycling trips in each borough.
Hackney has the lowest rate, 0.9 casualties per 1,000 daily cycling trips. Other boroughs with low rates are Newman at 1, Kensington & Chelsea, Camden at 1.2, and Islington at 1.4.
The borough with the highest rate in Inner London is Lewisham at 3.3.
Enfield has the lowest rate among Outer London boroughs at 1.1. Other boroughs like Croydon and Barking, and Dagenham are at 1.4.
But Bromley has the highest casualty rate amongst all boroughs—5.8.
Interventions and solutions for London’s cycling issues

Cycling Action Plan 2 is part of the Mayor of London’s Transport Strategy. The aim of this plan is to get more people cycling in London.
Since 2018, the government has created 340+ km of high-quality routes under the Cycleways brand to give cyclists safer and more appealing options.
In 2019, the government provided thousands of cycle parking spaces so people could securely park their bikes across London.
100+ low traffic neighbourhoods (LTN) have been created since 2020. LTNs are areas where through traffic is restricted, making streets safer and quieter for residents, including cyclists.
And to get more young people cycling, 100,470 children were trained to ride a bike, so young people can have the skills and confidence to cycle on roads.
Through all this, London is improving its cycling infrastructure, safety, and cycling across the city.
References
- Matters, T. F. L. |. E. J. (n.d.). New TfL data shows cycling journeys in London are up by 26 per cent compared to 2019 levels. Transport for London. https://tfl.gov.uk/info-for/media/press-releases/2024/november/new-tfl-data-shows-cycling-journeys-in-london-are-up-by-26-per-cent-compared-to-2019-levels
- Salmon, C. (2024, December 11). UK cycling accident and injury statistics 2024. https://www.cyclinginjurylegal.co.uk/uk-cycling-accident-injury-statistics
- Transport for London. (n.d.). [Cycling action plan 2]. In Cycling Action Plan 2.
- Transport for London. (2025). Travel in London 2024. https://content.tfl.gov.uk/travel-in-london-2024-active-travel-trends-acc.pdf#page7
- Unknown. (2024). 2024 London Boroughs Healthy Streets Scorecard indicator results summaries. https://www.healthystreetsscorecard.london/wp-content/uploads/2024/07/2024-Scorecard-INDICATOR-RESULTS-summaries.pdf#page3