

Key insights
- Statista reported that knife crime has been increasing over the years. It reached 15,016 incidents in 2023/24, which was close to pre-pandemic levels.
- According to data from the Office for National Statistics, kitchen knives were the most commonly used weapons in homicides.
- The House of Commons Library recorded that the boroughs with the highest number of knife crimes in 2022/23 and 2023/24 were Westminster, Croydon, and Lambeth.
- The Greater London Authority (GLA) reported a significant gender gap in knife crime, with 90% of offenders being male and just 10% female in 2017.
- Data from the London City Hall revealed that in 2016/17, knife crime injuries in London were nearly evenly distributed between young and older victims.
- The Policy Exchange reported that from 2012 to 2020, Black individuals were nearly five times more likely to be hospitalised for stabbings than White or Asian individuals.
- Members of Parliament argue that the rise in knife crime is linked to cuts in funding for youth services.
- According to The Guardian, the rise in online knife sales contributes to the increase in knife crime in London. This can be because young people can buy them online without age checks.
- The Standard reported that the violent crime in London costs £7 billion annually.
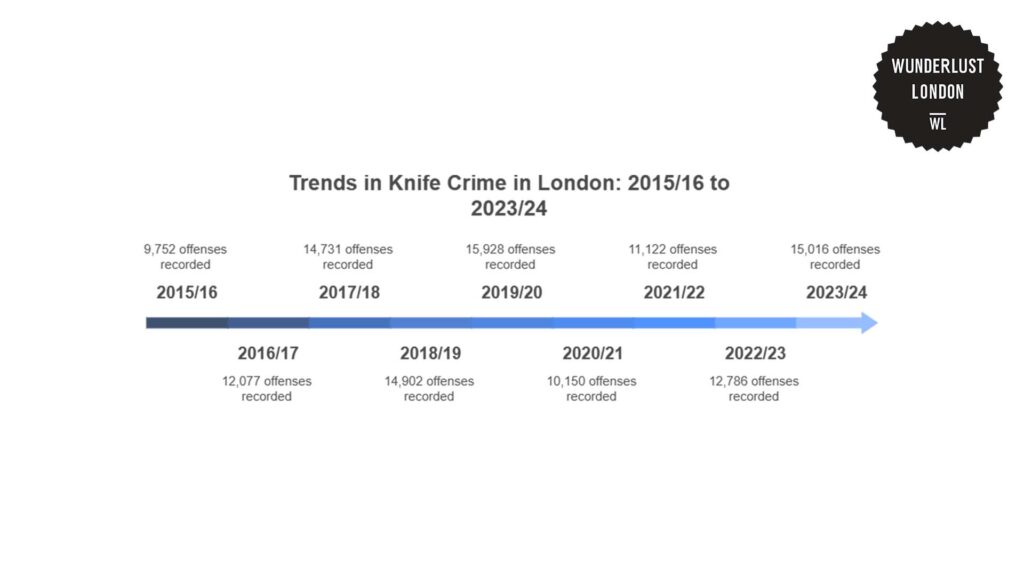
Knife crime remains a concerning issue in London. According to Statista, there has been an upward trend in police-recorded knife or sharp instrument offences over the years.
Starting at 9,572 in 2015/16, the numbers steadily rose, peaking at 15,928 in 2019/20. This suggests that knife crime became a growing issue over time.
The sharp drop in 2020/21 to 10,150 stands out, likely influenced by the COVID-19 pandemic. Lockdowns and movement restrictions meant fewer people were on the streets, reducing opportunities for such crimes.
However, as restrictions eased, offences began to rise again. It reached 15,016 in 2023/24, which was close to pre-pandemic levels.
Knife crime statistics in England and Wales
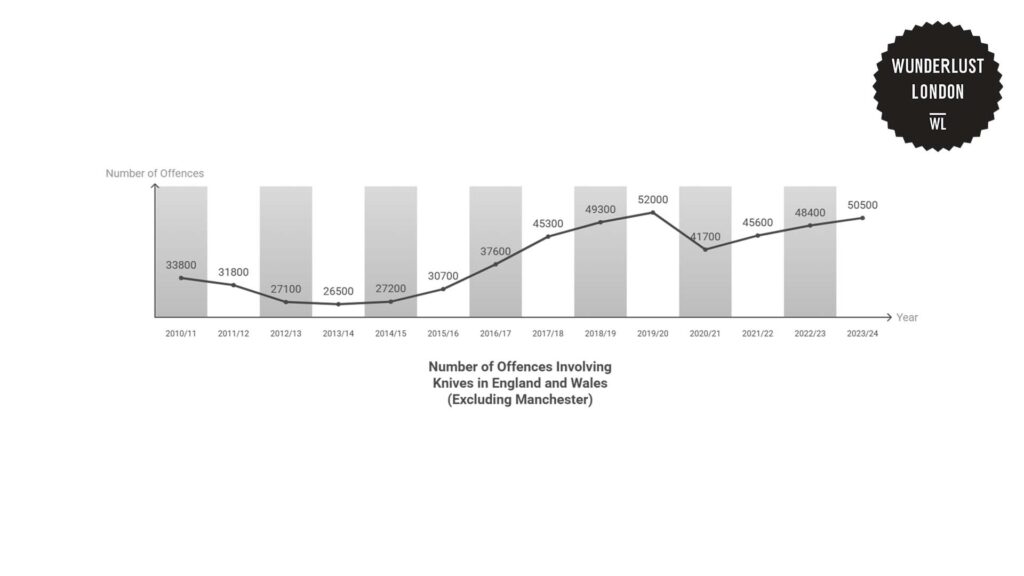
Data from the House of Commons Library showed that knife-crime related offences in England and Wales (excluding Manchester) initially dropped from 33,800 in 2010/11 to 26,500 in 2013/14.
The law enforcement strategies or crime prevention measures were possibly effective at that time, so knife crimes decreased.
However, the numbers began to rise again from 2014/15 onwards, following a similar trend seen in London. The numbers kept increasing, reaching 52,000 in 2019/20, which was almost double the lowest point in 2013/14.
In 2020/21, offences dropped significantly, likely due to the pandemic. But as restrictions eased, the offences climbed again. It even reached 50,500 in 2023/24.
This shows that while external factors like lockdowns can temporarily reduce crime, the underlying issue remains and continues to be a challenge.
Statistics on violent and sexual offences involving knives in England and Wales
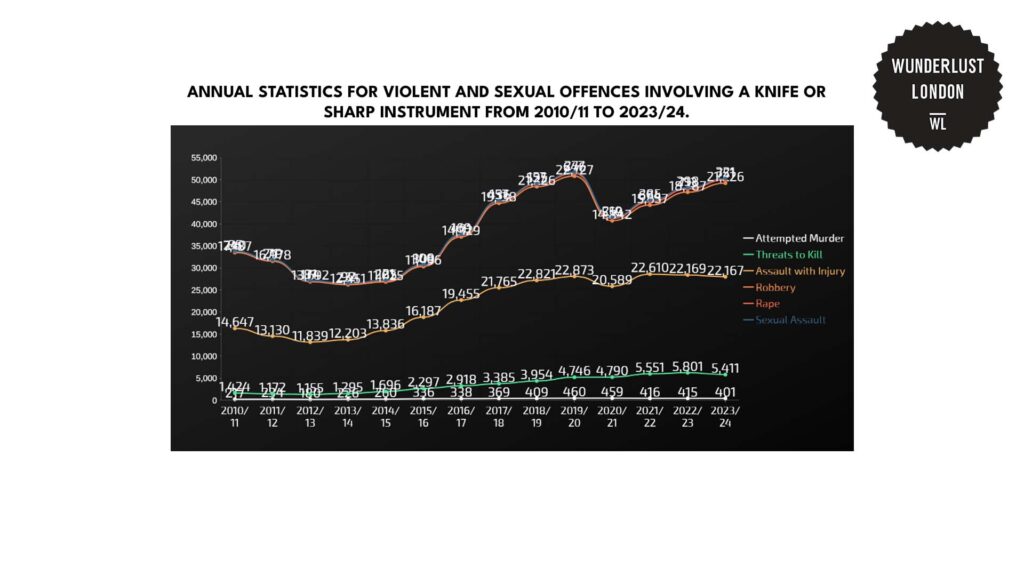
The Office for National Statistics also provided data about violent and sexual crimes involving a knife or sharp instrument in England and Wales, but excluding the Greater Manchester Police. It’s recorded by the police from 2010 to 2024.
One noticeable trend is that the number of incidents involving knives increased significantly, especially between 2015 and 2018. Something might have caused a jump in knife-related crimes during that time.
After 2018, the numbers kept rising, though there were some fluctuations.
The number of robberies involving knives dropped slightly between 2019 and 2023 but then went back up in 2023/24.
Similarly, the numbers for sexual offences like rape and sexual assault have increased. This could be due to both more reporting of these crimes and a rise in the crimes themselves.
Statistics on homicides involving knives in England and Wales
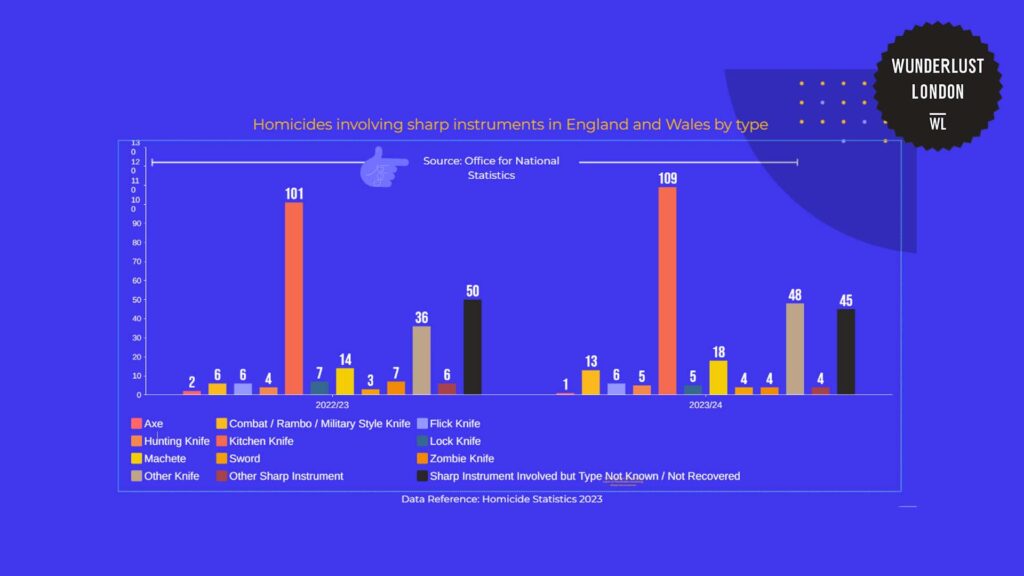
Looking at the data recorded by the Office for National Statistics from April 2022 to March 2024, kitchen knives were the most commonly used sharp instruments in homicides. Their use even increased slightly from 101 to 109 cases.
This suggests that everyday household items remain the most accessible and frequently used weapons in such crimes.
There’s a noticeable increase in the use of combat, rambo, or military-style knives from 6 to 13 cases. That’s more than double and may point to growing access to or interest in these kinds of aggressive-looking weapons.
Machetes also showed an increase, from 14 to 18. These types of weapons are often associated with violent group attacks, so the rise might reflect changes in how certain crimes are being carried out.
Some types (like zombie knives, lock knives, and axes) actually went down. Zombie knives, which have been a concern for authorities due to their intimidating appearance, dropped from 7 to 4. This is possibly due to stricter regulations and police crackdowns.
The number of cases where the type of knife wasn’t recovered or identified fell slightly from 50 to 45. This might suggest improvements in evidence collection or reporting.
Knife crime statistics by London boroughs
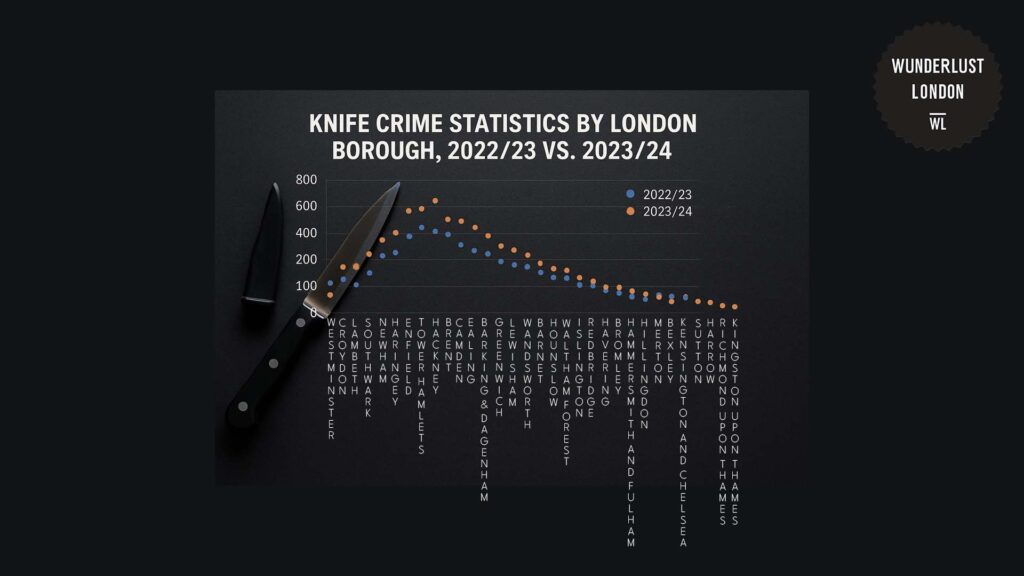
The House of Commons Library recorded the number of knife crimes in various London boroughs for 2022/23 and 2023/24.
There is an increase in knife crimes across most boroughs for these consecutive years. Westminster saw a rise from 823 incidents to 904, and Croydon went up from 654 to 868. Newham, Haringey, and Southwark also had this same rising pattern.
Some boroughs, however, saw smaller increases or even a decrease. Islington experienced a drop in knife crimes, going from 436 to 398.
Barnet’s numbers stayed relatively steady, with a slight decrease from 447 to 445.
The boroughs with the highest number of knife crimes in both years are Westminster, Croydon, and Lambeth. Each of these boroughs consistently saw a significant number of incidents.
These areas may have faced higher population density or socio-economic factors contributing to crime rates.
On the other hand, boroughs like Richmond upon Thames, Kingson upon Thames, and Sutton report much lower numbers.
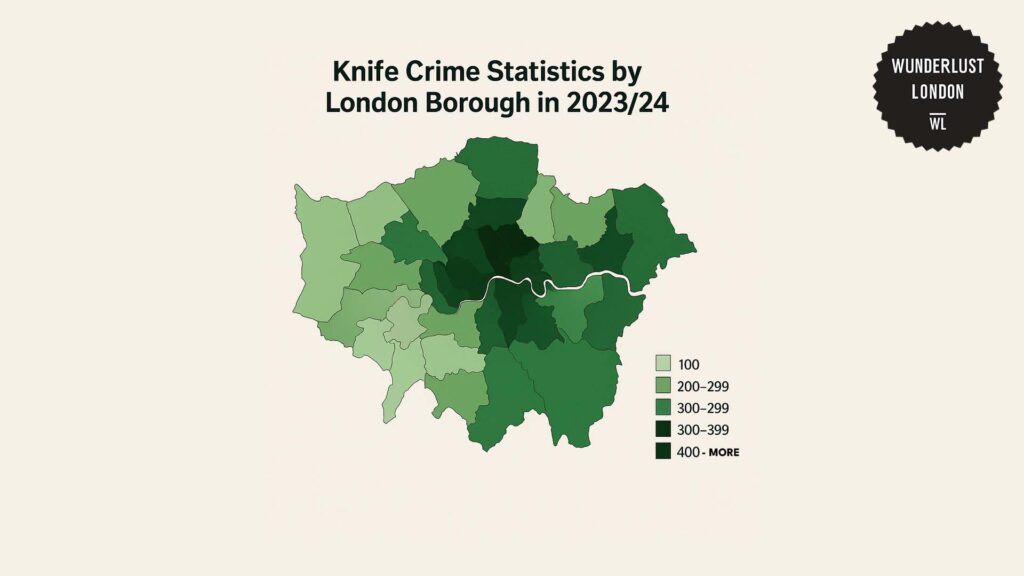
To visualise knife crime levels across London boroughs, the map below offers a comparative view.
Demographic analysis of knife crime offenders in London
Knife crime offenders in London by age
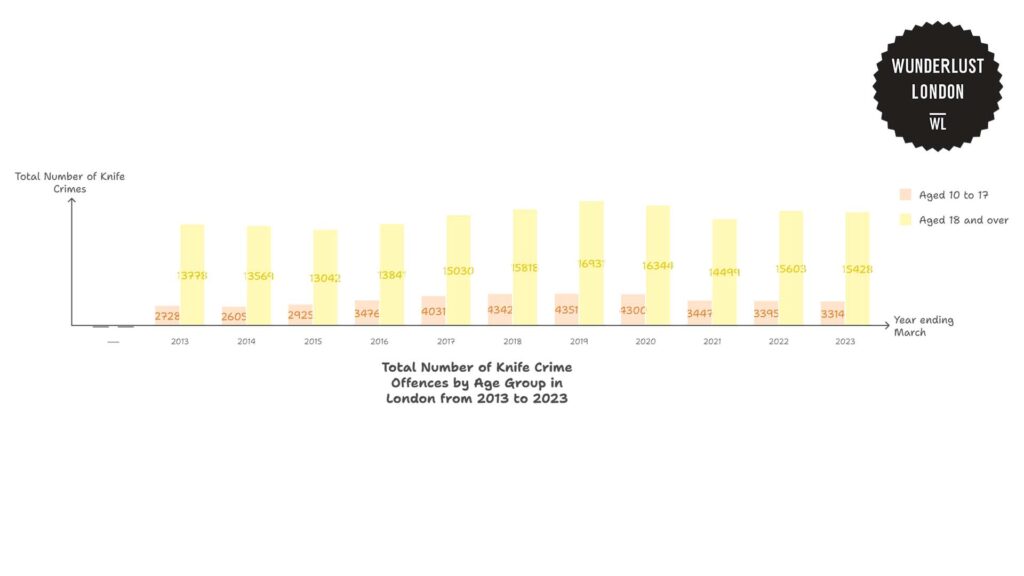
GOV.UK didn’t break down knife crime offenders in London by specific age groups, but they did provide data for two groups– those aged 18 and over and those aged 10 to 17, for the years 2013 to 2023.
The total number of offenders aged 18 and over has fluctuated over the years but generally increased from 13,778 in 2013 to 15,428 in 2023.
The highest peak occurred in 2018 with 15,818 offenders, and the lowest was in 2020 with 16,344 offenders.
Despite these fluctuations, the overall number of older offenders has remained high. This reflects a consistent level of adult involvement in knife crimes.
There was an increase in offenders aged 10 to 17, from 2,728 in 2013 to 4,342 in 2018. However, after 2018, the numbers in this younger age group started to drop.
By 2023, there were 3,314 younger offenders. This is lower than the peak in 2018 but still above the numbers seen in the early years.
The increase in knife crime among younger people until 2018 could be linked to a range of social factors, such as gang activity or youth violence.
Knife crime offenders in London by gender

According to the Greater London Authority, there’s a striking gender disparity in knife crime involvement.
In 2017, 90% of knife crime offenders were male, and only 10% were female.
This difference could be due to various social and cultural factors like men being more involved in gangs, socio-economic pressures, and dealing with cultural expectations of masculinity that might encourage violent behaviour.
While fewer women commit knife crimes, this still highlights the need for targeted support to understand why some women get involved in these offences.
Demographic analysis of knife crime victims in London
Knife crime victims in London by age

Data from the London City Hall showed that knife crime injuries in London in the year 2016/17 were almost evenly split between young and older victims.
Out of 4,415 knife crime injury victims, 2,028 (46%) were under 25 and not linked to domestic abuse, while 2,387 (54%) were victims over 25. The number of young victims also increased by 24.7% from the previous year.
Although older victims make up the majority, the fact that almost half are young people is concerning.
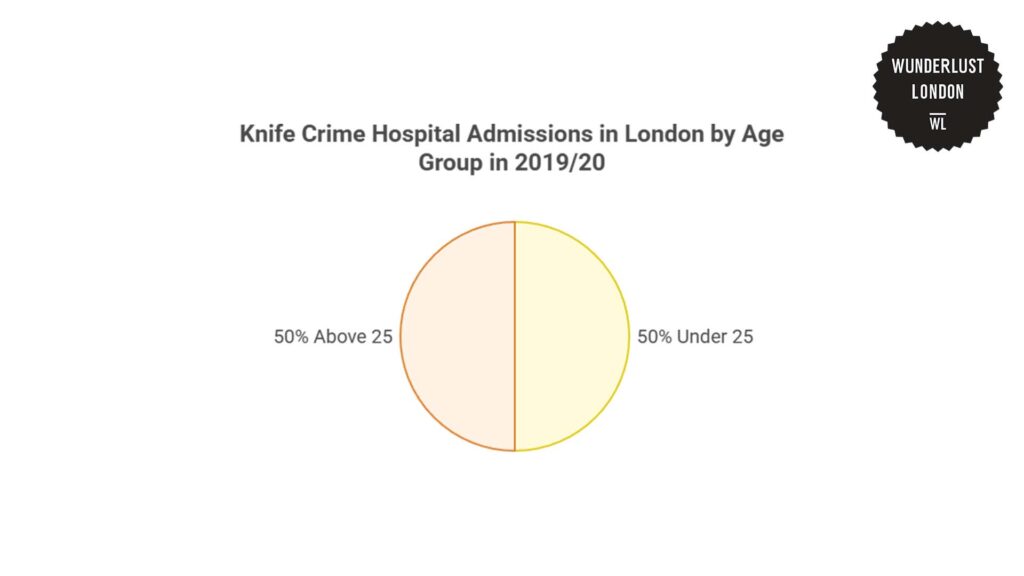
In 2019/20, Policy Exchange also released a data set about hospital admissions due to stabbings in London. Both age groups, under 25 and over 25, were equally represented with 50% of the admissions.
This suggests that, by 2019/20, knife crime was affecting adults just as much as it was affecting young people. It’s a stark reminder that this isn’t just a youth issue.
Knife crime victims in London by gender
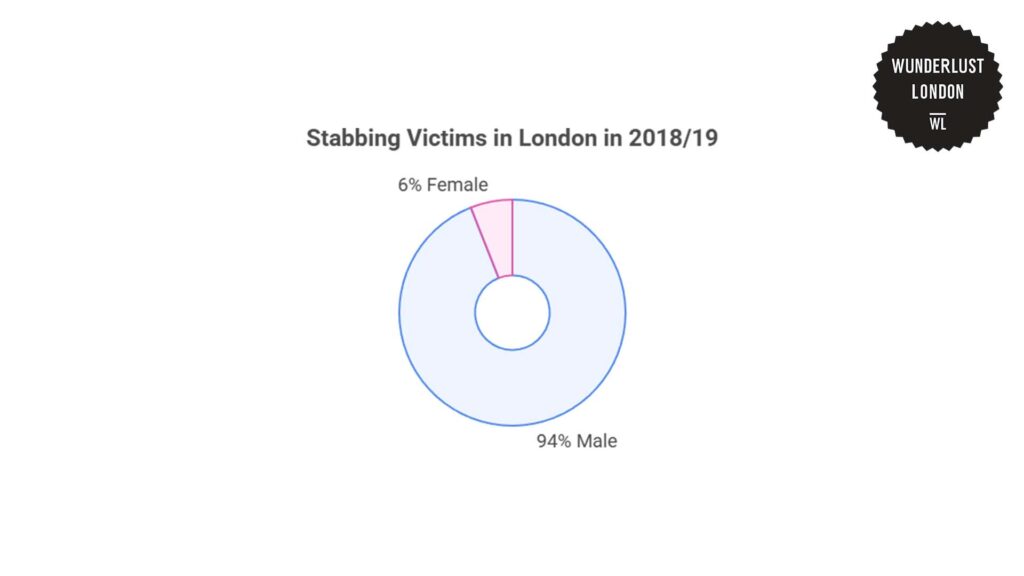
Policy Exchange showed a great gender disparity of stabbing victims in London during 2018/19. Males represented 94% of victims, while females made up only 6%.
This trend isn’t new. Since 2013, there has been an increase in stabbings, mainly involving more male victims.
The higher number of men affected by knife crime could be due to factors like gang violence, economic struggles, and issues that tend to impact more men than women.
Victims of homicide involving sharp instruments in England and Wales by gender
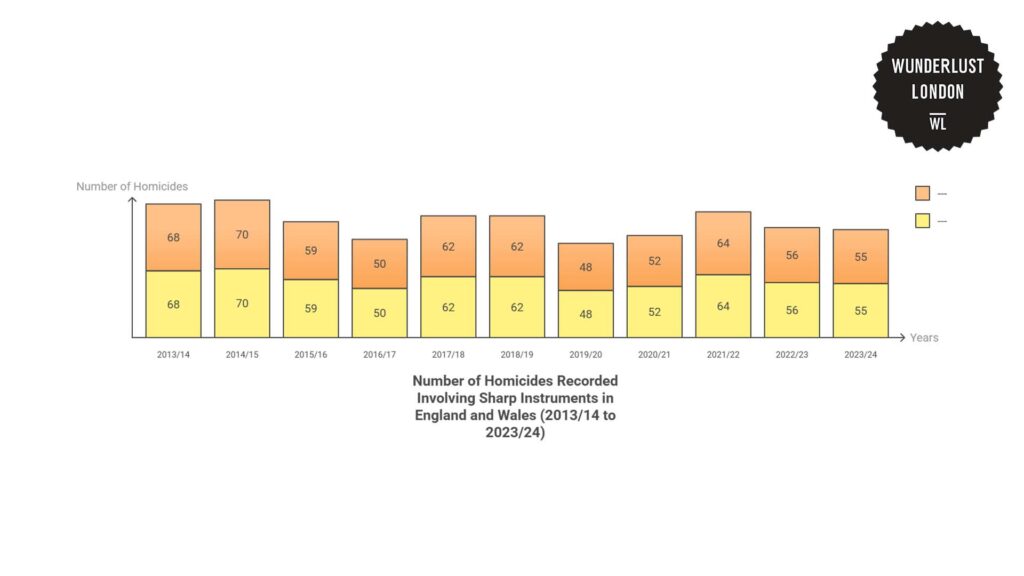
Data from the Office for National Statistics showed how many men and women were killed using sharp instruments over the past 11 years in England and Wales.
Men are far more likely to be victims of this kind of violence than women.
In earlier years, like 2013/13 and 2014/15, the numbers were a bit lower for both men and women. However, starting from 2015/16, there was a rise in male victims. It reached a peak in 2017/18 with 220 cases.
Women didn’t show the same kind of increase. The numbers for female victims stayed relatively steady, hovering between 50 and 70 each year.
After that spike, there was a drop in male victim numbers over the next couple of years. This drop continued through 2020/21, possibly connected to the COVID-10 lockdowns, where fewer people were out in public. But once restrictions eased, there was a rise again in 2021/22.
In the last two years, the numbers have levelled out a bit. Male victims stayed at 187 in both 2022/23 and 2023/24, while female victims were slightly lower than in previous years.
Knife crime victims in London by ethnicity
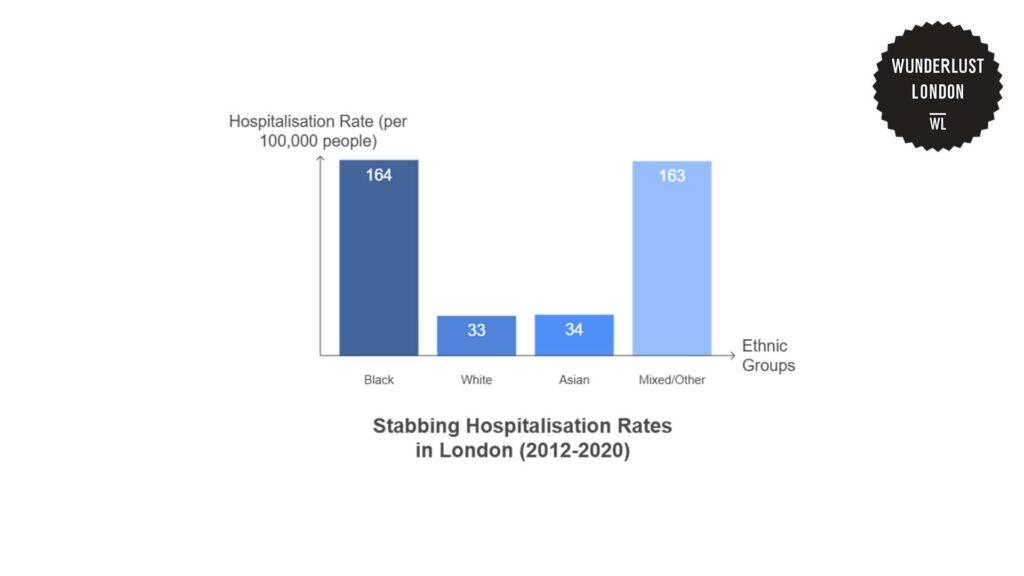
The Policy Exchange also shared some data about the hospitalisation rates for stabbings across different ethnic groups from 2012 to 2020.
Black individuals are significantly more likely to be hospitalised for stabbings than those from other ethnic groups.
With a rate of 164 hospitalisations per 100,000 people, they are nearly five times more likely to be hospitalised for stab wounds compared to White (33 per 100,000) and Asian (34 per 100,000) individuals.
The rates for Mixed/Other ethnicities are also high, at 163 per 100,000, which is almost the same as for Black individuals. This suggests that the factor behind these higher hospitalisation rates might affect both Black and Mixed/Other ethnic groups in similar ways.
Contributing factors to the rising knife crimes in London
Youth service budget cuts linked to rising knife crime in London
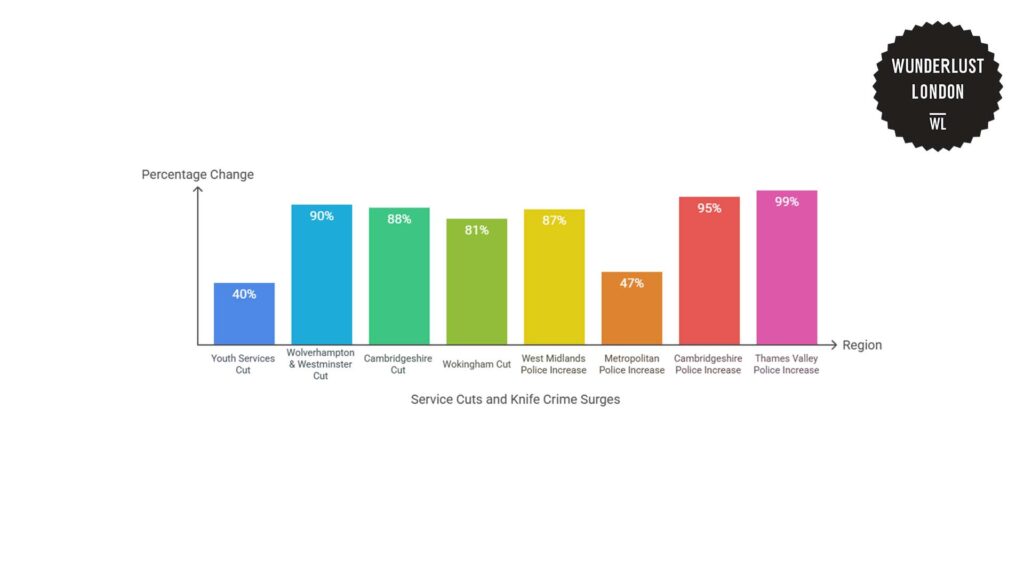
According to the Members of Parliament (MPs), as funding for youth services has been slashed, knife crime has surged.
Across England and Wales, the average cut to youth services was 40% over just three years. Some areas were hit much harder, with Wolverhampton, Westminster, and Cambridgeshire seeing fund drops of over 88%.
At the same time, police recorded a 68% rise in knife offences from around 25,500 in 2014 to nearly 43,000 by 2018.
Areas with the deepest youth service cuts, like Cambridgeshire and Thames Valley, saw knife crime rise by 99%.
This trend suggests that when youth services disappear, young people may be left without support, structure, or safe places to go. That absence can leave them more vulnerable to getting involved in crime.
Gang culture’s role in rising knife crime in London
A report by the GLA stated that gang members are much more likely to carry knives compared to non-gang members.
However, it’s also important to note that recent data suggests that most knife crime isn’t gang-related.
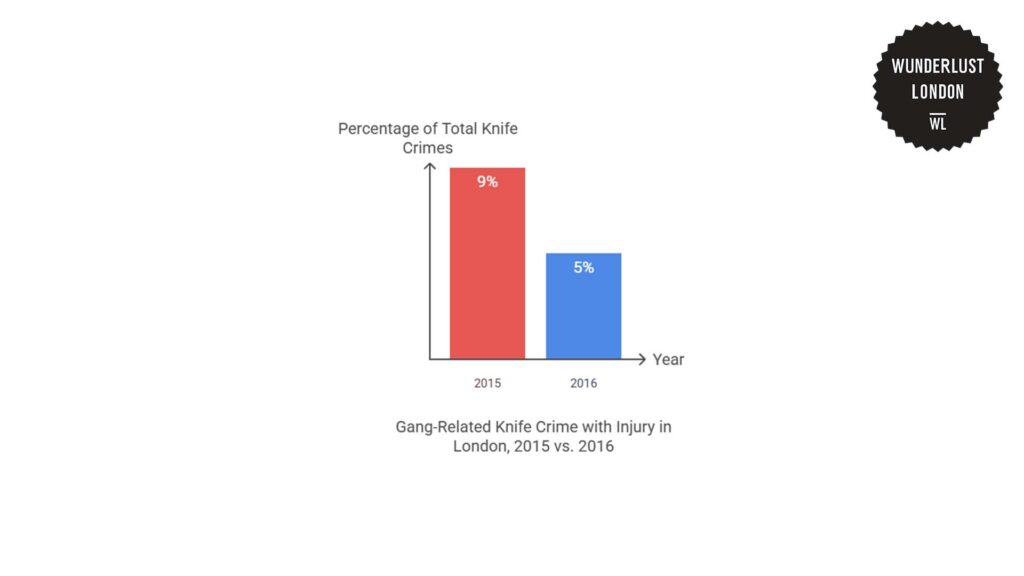
In 2016, gang-related knife crimes with injury accounted for just 5% of all knife crimes, which was down from 9% the previous year.
Despite this, knife crimes connected to gangs tend to be more violent. Victims of these crimes are often young males from a Black, Asian, and Minority Ethnic (BAME) background.
Online knife sales as a contributing factor to knife crimes
The rise in online knife sales is playing a big part in the increase in knife crimes in London.
The Guardian reported that young people, in particular, are able to buy large knives online without anyone checking how old they are. This makes it easier for them to get hold of weapons, which leads to more violence.
Social media platforms like Telegram and TikTok are becoming common places for buying knives. Many of these knives are designed to look intimidating, like the zombie knives or machetes.
Because age checks aren’t always done properly, even teenagers can buy them easily.
To understand the process of selling knives, the National Police Chiefs’ Council released an end-to-end report discussing this last January 2025.
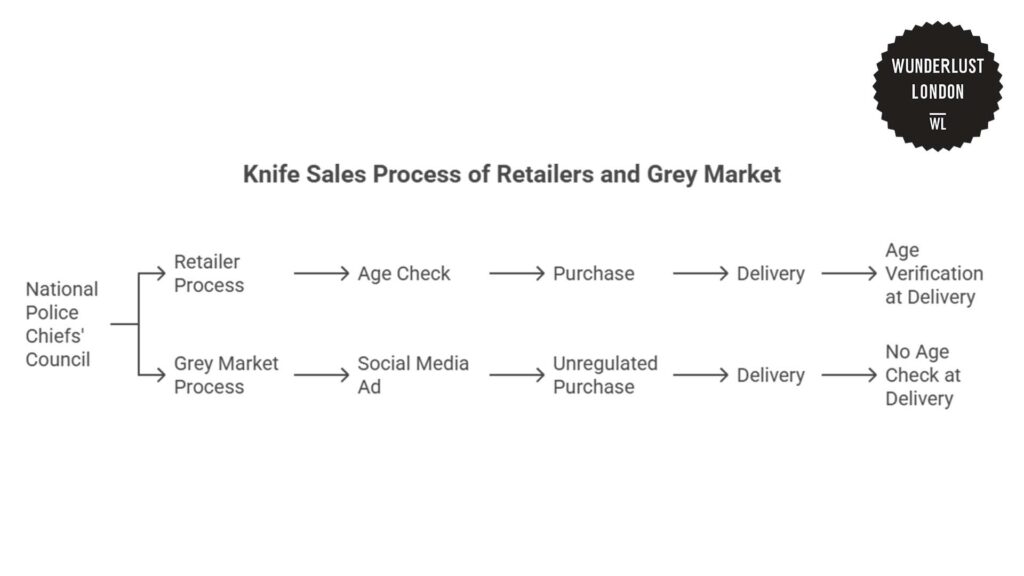
The report mentioned two main types of sellers. Retailers are businesses that follow the law. They make sure buyers are over 18 by asking for proof of age before selling knives.
Grey market sellers, on the other hand, often ignore these rules. They use social media to sell knives and don’t always check if buyers are old enough, making it easier for underage people to buy them.
The financial impact of violent crimes in London
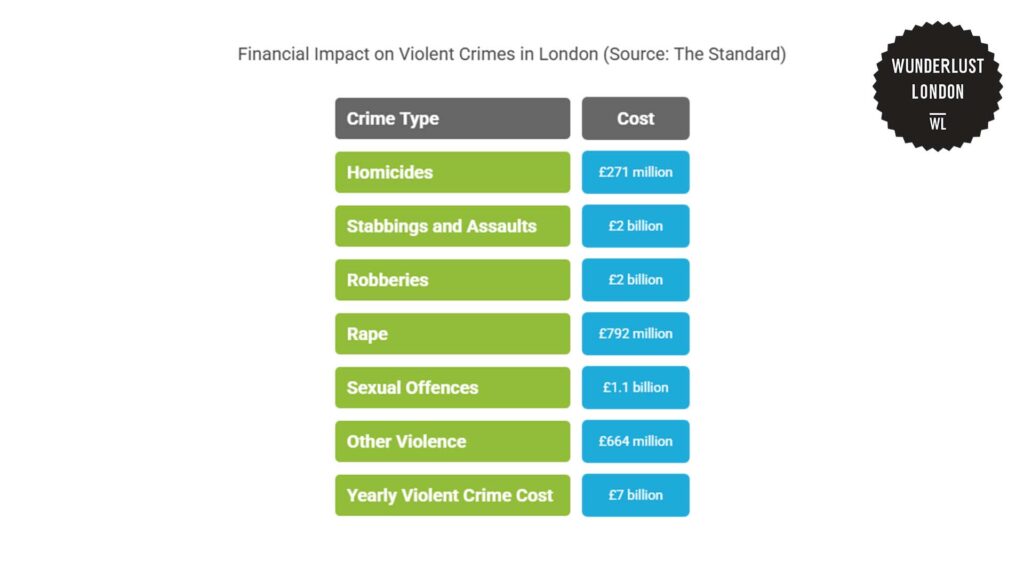
The financial cost of violent crime in London is staggering, amounting to £7 billion each year, according to The Standard.
A significant portion of this comes from violent crimes like stabbings, which are a major part of the city’s ongoing knife crime issue. The combined cost of violent crimes, such as stabbings and assaults alone, is £2 billion.
Knife crime, particularly stabbings, not only results in immediate medical and emergency service costs but also creates long-term economic damage. This includes police investigations, criminal justice proceedings, and lost productivity due to injuries or deaths.
Sentencing guidelines on penalties to knives and offensive weapons
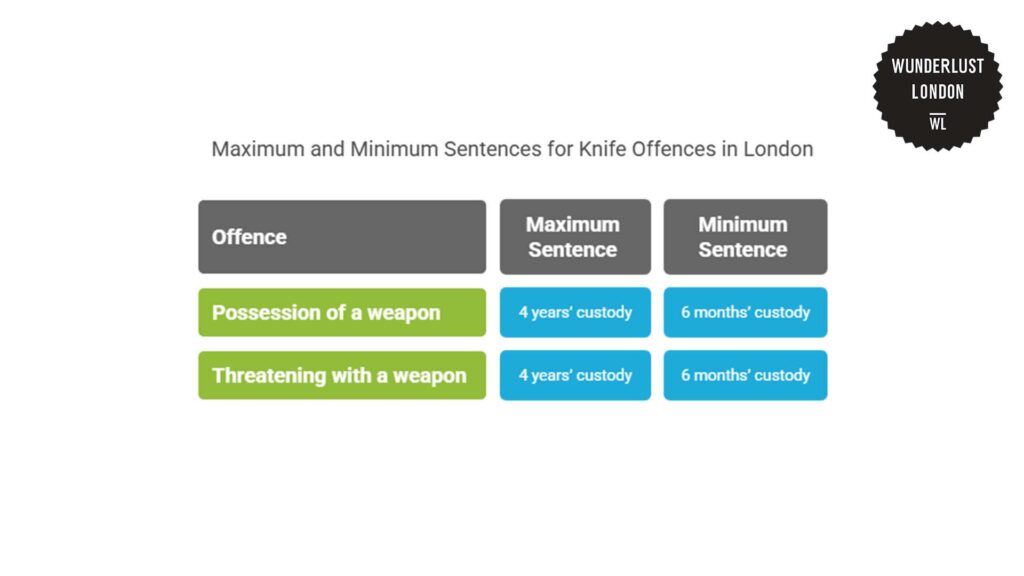
The Sentencing Council provided sentencing guidelines for two specific offences: possession of a weapon and threatening with a weapon.
Both offences carry the same maximum sentence of 4 years’ custody, but the minimum sentence can change depending on the situation.
The minimum sentence for possession of a weapon is 6 months’ custody. However, this is mainly for people who have committed the same crime before or have a history of related offences, like threatening someone with a weapon.
This shows that an offender’s past plays a role in deciding how serious their punishment should be. Repeat offenders usually get harsher sentences.
The crime of threatening with a weapon also has a minimum sentence of 6 months in prison. This is to reflect how serious the threat is, even if no one is physically hurt.
Threatening someone can cause a lot of fear or harm, so the law sets a clear minimum sentence to make sure threats are taken seriously and punished consistently.
London’s interventions and policies in addressing knife crimes
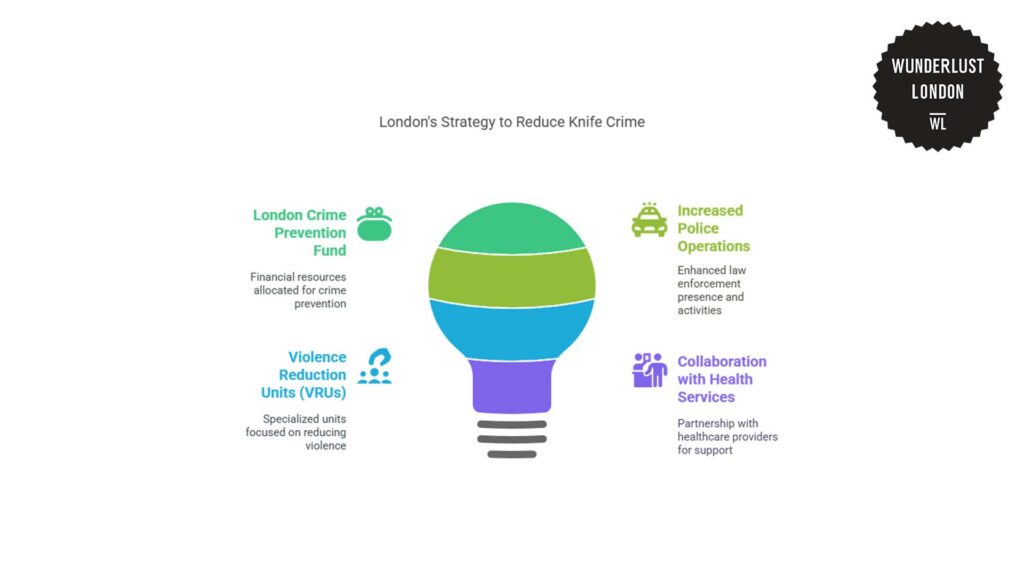
According to the GLA, Mayor Sadiq Khan continues to implement strategies to reduce knife crime in London.
He has committed £72 million over the Police and Crime Plan period to support projects dedicated to preventing crime. This includes £5 million specifically targeting youth and knife crime.
This funding helps programs that engage young people, provide community support, and offer restorative justice.
Increased police operations also target knife crime by focusing on hotspots and known offenders. Tactics include weapon sweeps, stop-and-search, and patrols in high-crime areas to deter violence.
On the other hand, Violence Reduction Units (VRUs) take a public health approach, treating violence as an epidemic. They work with schools, mental health services, and local groups to provide support to young people and prevent violence from escalating.
Hospitals like St. George’s have also introduced knife amnesty bins, where people can safely dispose of weapons like machetes and zombie knives.
This initiative helps remove dangerous weapons from the streets and raises awareness of the risks and consequences of carrying such weapons.
References
- Allen, G., & Wong, H. (2025). Knife Crime Statistics England and Wales. House of Commons Library. https://commonslibrary.parliament.uk/research-briefings/sn04304/
- Clark, D. (2024). London Knife Crime 2024. Statista. https://www.statista.com/statistics/864736/knife-crime-in-london/
- Crime in England and Wales: Appendix tables. Office for National Statistics. (2025). https://www.ons.gov.uk/peoplepopulationandcommunity/crimeandjustice/datasets/crimeinenglandandwalesappendixtables
- Dodd, V. (2024). Young people buying large knives on telegram and Tiktok, police say. The Guardian. https://www.theguardian.com/uk-news/article/2024/may/15/young-people-buying-large-knives-on-telegram-and-tiktok-police-say
- Eichler, W. (2019). Cuts to youth services factor in rise of knife crime, MPs say. LocalGov.co.uk. https://www.localgov.co.uk/Cuts-to-youth-services-factor-in-rise-of-knife-crime-MPs-say/47353
- Falkner, S. (2021). Knife Crime in the Capital. Policy Exchange. https://policyexchange.org.uk/wp-content/uploads/2021/10/Knife-Crime-in-the-Capital.pdf
- France, A., & Cecil, N. (2024). £7 billion cost of London’s violent crime epidemic amid “cycle of fear.” The Standard. https://www.standard.co.uk/news/crime/london-cost-knife-crime-epidemic-metropolitan-police-sadiq-khan-violence-centre-for-social-justice-b1152884.html
- GOV.UK. (2025). Independent end-to-end review of online knife sales. GOV.UK. https://www.gov.uk/government/publications/independent-end-to-end-review-of-online-knife-sales
- Knife and Offensive Weapon Sentencing All tables Q2 2023. GOV.UK. (2023). https://assets.publishing.service.gov.uk/media/6554b38e371898000dd29764/Knife_and_Offensive_Weapon_Sentencing_All_Tables_Q2_2023.ods
- Knives and offensive weapons. Sentencing Council. (n.d.). https://www.sentencingcouncil.org.uk/outlines/knives-and-offensive-weapons/
- The London Knife Crime Strategy 2017. London City Hall. (2017). https://www.london.gov.uk/programmes-strategies/mayors-office-policing-and-crime/governance-and-decision-making/mopac-decisions-424
- The London Knife Crime Strategy. Greater London Authority. (2017). https://www.london.gov.uk/sites/default/files/mopac_knife_crime_strategy_june_2017.pdf