
Key insights
- The City of London reported that five special monitoring stations were set up across the city. The government tracks nitrogen dioxide (NO2) and larger particles (PM10).
- The City of London has over 70 air quality monitoring locations as of 2023.
- Based on the data from The City of London, Walbrook Wharf (90 μg/m³) and Beech St (80 μg/m³) initially had the highest concentrations but showed significant decreases over time.
- According to the City of London’s Air Quality Strategy, total NOx emissions are declining over time. They are dropping from approximately 600 tonnes in 2013 to a projected 325 tonnes by 2030, representing about a 46% reduction.
LondonAir states that bad air quality in London is a long-term problem that has been difficult to solve for some time now.
Studies from London Gov.UK report that while the UK monitors many air pollutants, two are particularly concerning in London:
- Particulate Matter (PM): These tiny particles can enter deep into your lungs and even your bloodstream. Smaller particles (PM2.5) are especially dangerous and are linked to asthma and other serious health problems.
- Nitrogen Dioxide (NO2): This gas can irritate your airways. Long-term exposure affects lung function and breathing and worsens asthma.
Recent air quality statistics in London
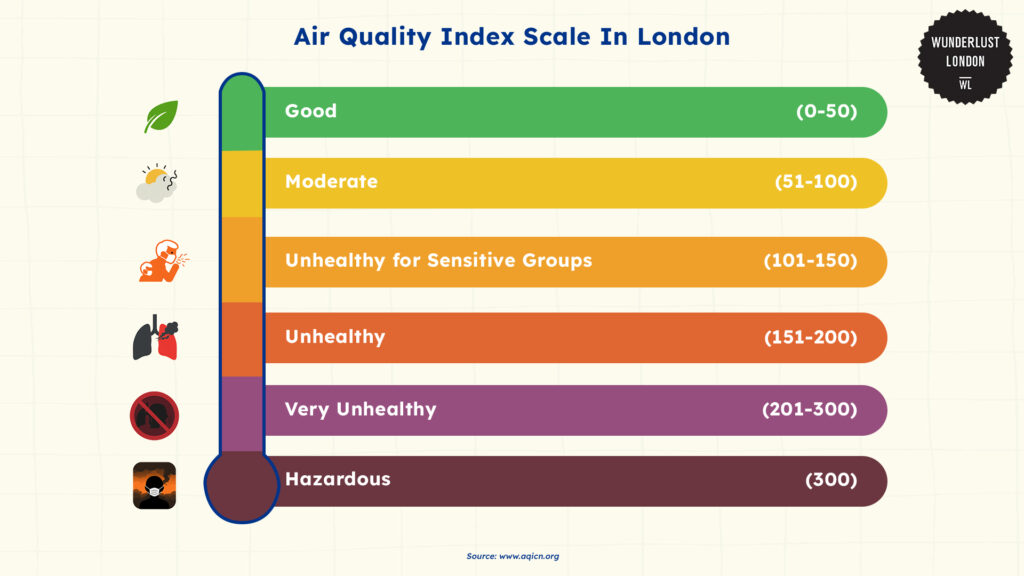
The Air Quality Index (AQI) scale based on ACIN categorises air pollution levels and their associated health implications relevant to London’s air quality measurements.
The AQI scale from ACIN is divided into six categories:
- Good (0-50)
- Moderate (51-100)
- Unhealthy for Sensitive Groups (101-150)
- Unhealthy (151-200)
- Very Unhealthy (201-300)
- Hazardous (300)
This helps us understand air quality statistics like the recent one below.
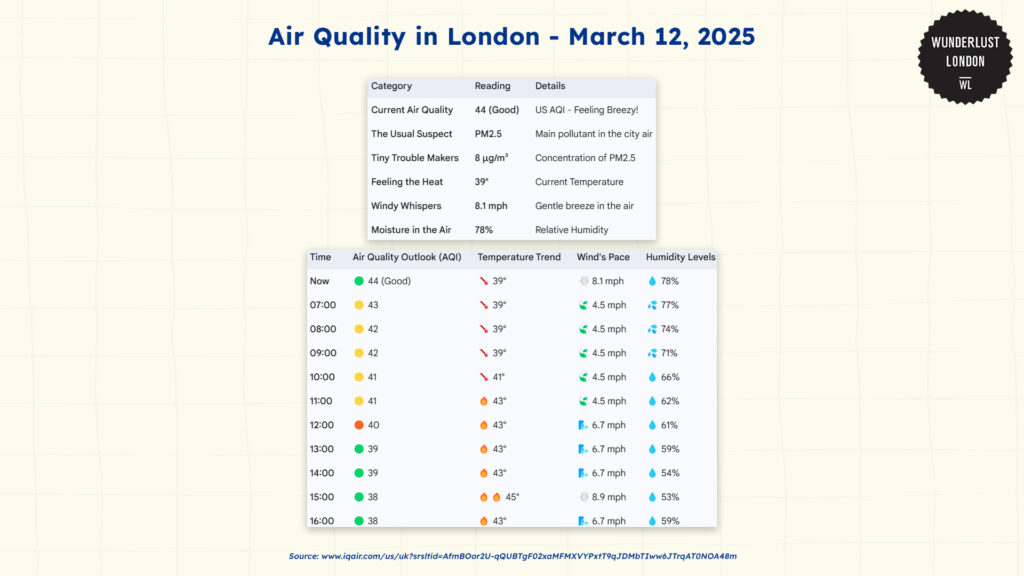
According to IQ Air, London’s air quality on March 12, 2025, was measured at a “Good” level with a US AQI (Air Quality Index) of 44.
Based on IQ Air, the main pollutant is PM2.5, with a concentration of 8 μg/m³. The hourly forecast indicates a slight improvement in air quality throughout the day, with the AQI gradually decreasing from 44 to 38 by 16:00.
Monitoring air quality statistics in London
The City of London reports that it has been managing its air quality since the 1960s. Before the Clean Air Act of 1956 came into effect, they monitored sulphur dioxide.
As of now, five special monitoring stations are set up across the city to track and measure nitrogen dioxide (NO2), larger particles (PM10), smaller particles (PM2.5), and ozone (O3).
These stations work 24/7, giving hourly updates on pollution levels.
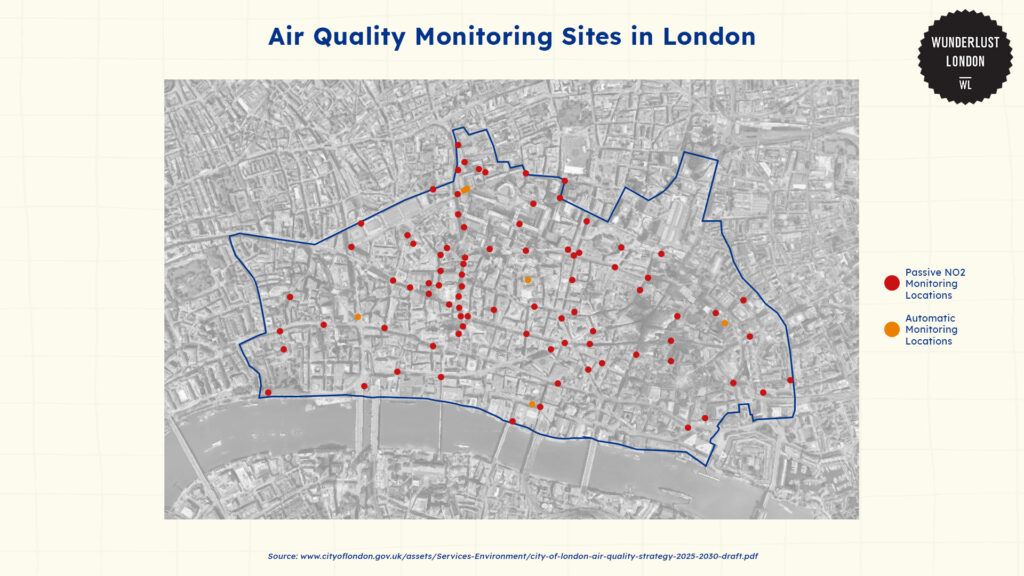
The map from the City of London shows over 70 monitoring locations as of 2023, surrounded by a red boundary line indicating the city limits. The black dots represent passive NO2 monitoring locations, and the purple dots indicate automatic monitoring sites.
Based on studies from the City of London, monitoring the air quality in this way allows for assessing compliance with standards, tracking long-term trends to evaluate policy effectiveness, and raising public awareness when pollution levels are high.
Statistics of nitrogen dioxide concentrations across London
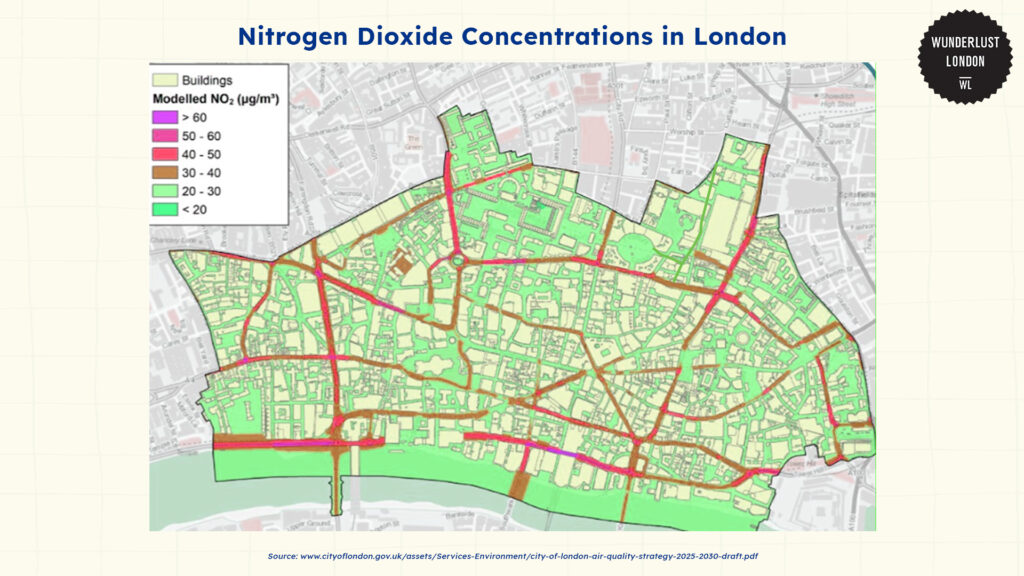
According to the data from The City of London, this map displays the nitrogen dioxide (NO₂) concentrations across the Square Mile of London, with different colors representing concentration levels.
Areas in blue and light blue have the lowest concentrations (<20 and 20-30 μg/m³). Meanwhile, yellow, orange, and red areas indicate higher pollution levels (40-50, 50-60, and >60 μg/m³, respectively).
Most of the Square Mile appears to be in the lower concentration ranges (blue and green), with some yellow corridors likely representing major roadways.
Annual mean of nitrogen dioxide in London
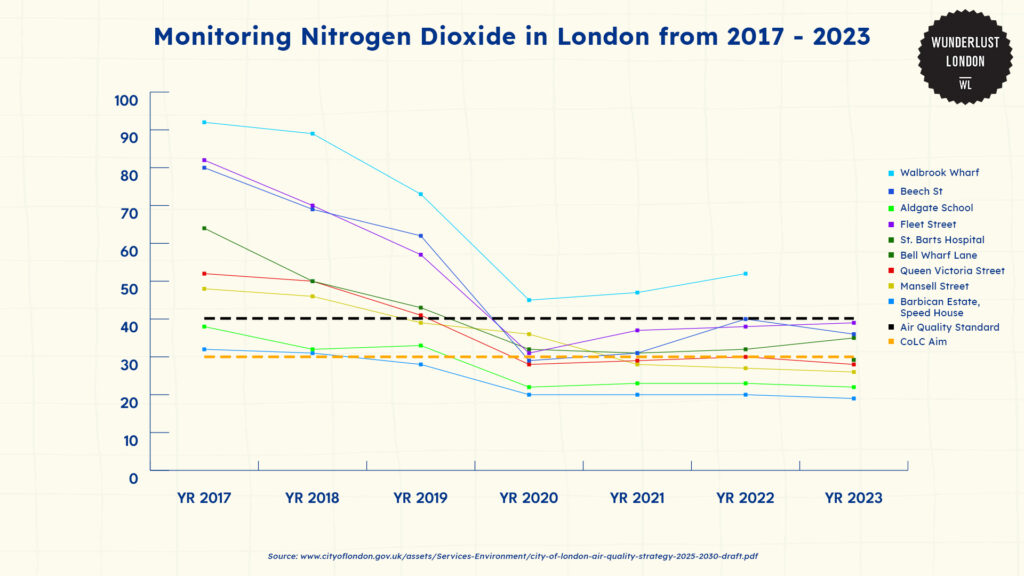
The data in this line graph from The City of London depicts annual mean nitrogen dioxide levels at continuous monitoring sites.
Based on the data from The City of London, Walbrook Wharf (90 μg/m³) and Beech St (80 μg/m³) initially had the highest concentrations but showed significant decreases over time.
A dramatic drop occurred in 2020 during the COVID-19 pandemic, when all sites fell below 40 μg/m³.
By 2023, Walbrook Wharf rebounded slightly to about 50 μg/m³, while Aldgate School and Beech St continued declining to approximately 20-30 μg/m³. All sites ended below the Air Quality Standard (black dashed line at 40 μg/m³).
Amount of particulate matter in London
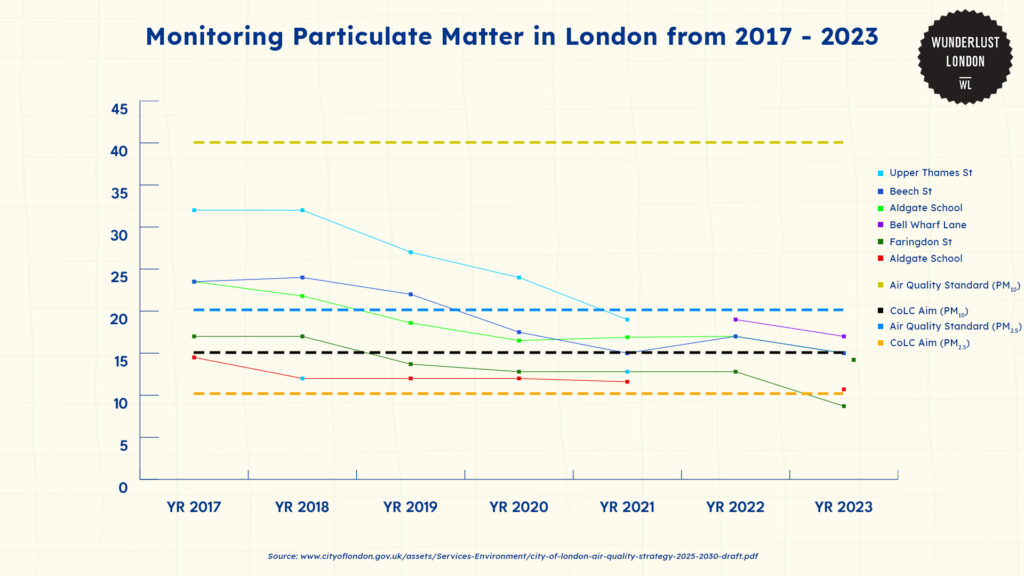
Based on the data from The City Of London, there’s been a clear downward trend across all monitoring sites from 2017 to 2023. Upper Thames St started with the highest concentrations (around 32 μg/m³ in 2017) but has decreased significantly to about 20 μg/m³ by 2023.
Monitoring sites (Farringdon St and Aldgate School) show steady improvement from 2017 to 2023. Farringdon St started higher at approximately 16 μg/m³ in 2017 and has decreased to about 10 μg/m³ by 2023.
All sites show concentrations below the Air Quality Standard (black dashed line at 40 μg/m³) and are approaching the CoLC Aim (red dashed line at 15 μg/m³).
The aim to achieve 15μg/m³ by 2030 was met early at Beech Street in 2021 and Aldgate School in 2023, showing successful pollution reduction efforts.
Geographic distribution of air quality in London
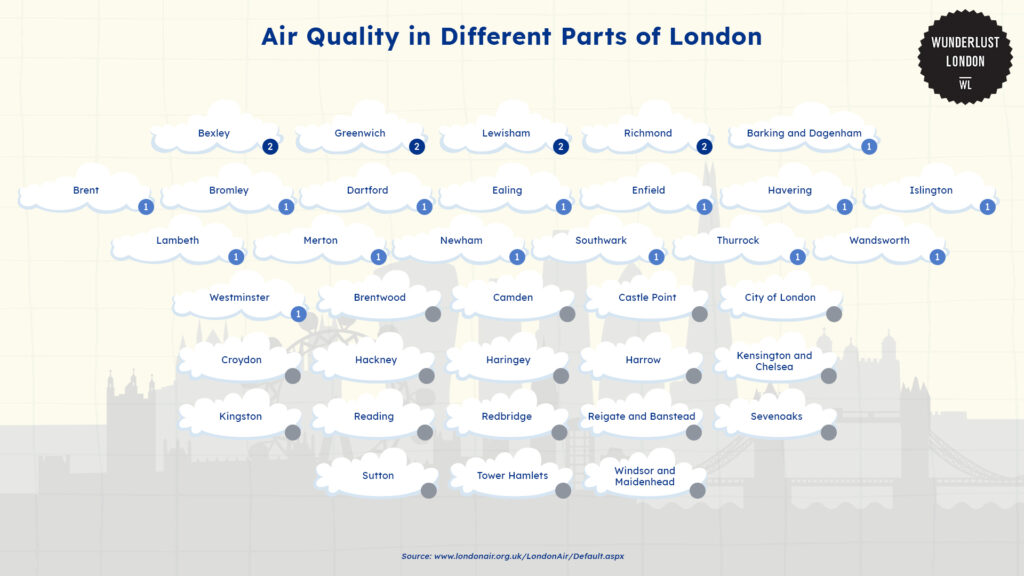
According to London Air, approximately 47% of the displayed authorities have the best rating (1), while 13% have a moderate rating (2). The remaining 40% don’t display any data.
Bromley, Southwark, and Wandswoth, amongst other authorities, have a rating of 1. A rating of 1 means the local authority has a low level of air pollution and that the air quality is healthy and good.
A rating of 2 refers to a moderate level of air pollution. Greenwich, Richmond, Bexley and other places within London have an air quality rating of 2.
London air quality pollution trends & predictions
Nitrogen oxide emission trends in London
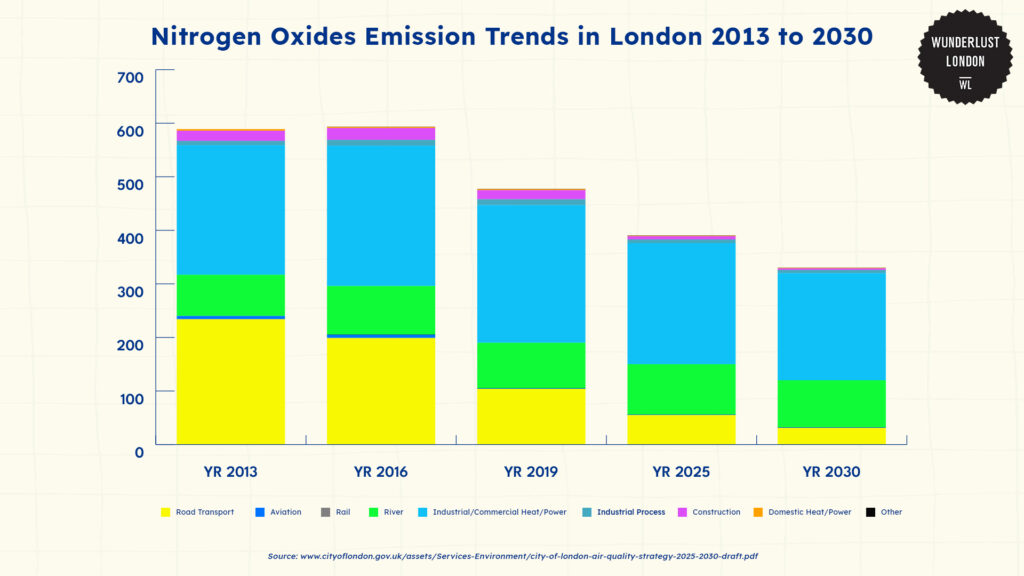
According to the City of London’s Air Quality Strategy, total NOx emissions are declining over time. They are dropping from approximately 600 tonnes in 2013 to a projected 325 tonnes by 2030, representing about a 46% reduction.
Road transport was the largest contributor in 2013, accounting for roughly 40% of all emissions. However, it also has the most dramatic decline, projected to decrease by 85-90% by 2030.
As other sources decline, Industrial/Commercial Heat/Power is predicted to become the dominant emission source by 2025 and 2030. By 2030, it may represent about 55-60% of all remaining NOx emissions.
Other smaller contributors have minimal visible changes in their contributions.
Particulate matter trends in London
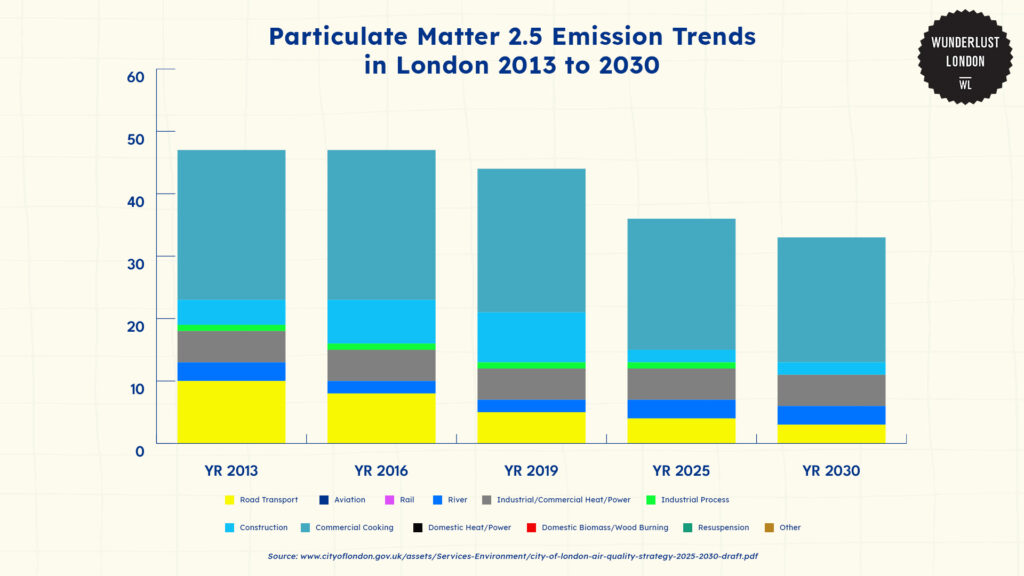
Based on the City of London’s Air Quality Strategy, particulate matter pollution with a diameter of 2.5 micrometers or less decreased in overall emissions from 2013 to 2030.
The total emissions decreased from approximately 47 μg/m³ in 2013 to about 32 μg/m³ in 2030. This means it’s roughly a 32% reduction.
Road transport accounted for approximately 25% of emissions in 2013, but its share is expected to decrease to about 15% by 2030. Domestic biomass/wood burning maintains around 20-25% of total emissions.
The aviation sector is responsible for approximately 5-7% of emissions across all years. Construction-related emissions show a slight decrease over time, dropping from roughly 10% to 7% of the total.
Industrial processes maintain a contribution of about 5% throughout the forecast period. River-related emissions represent the smallest share, accounting for less than 5%.
Particulate matter 10 emission in London statistics
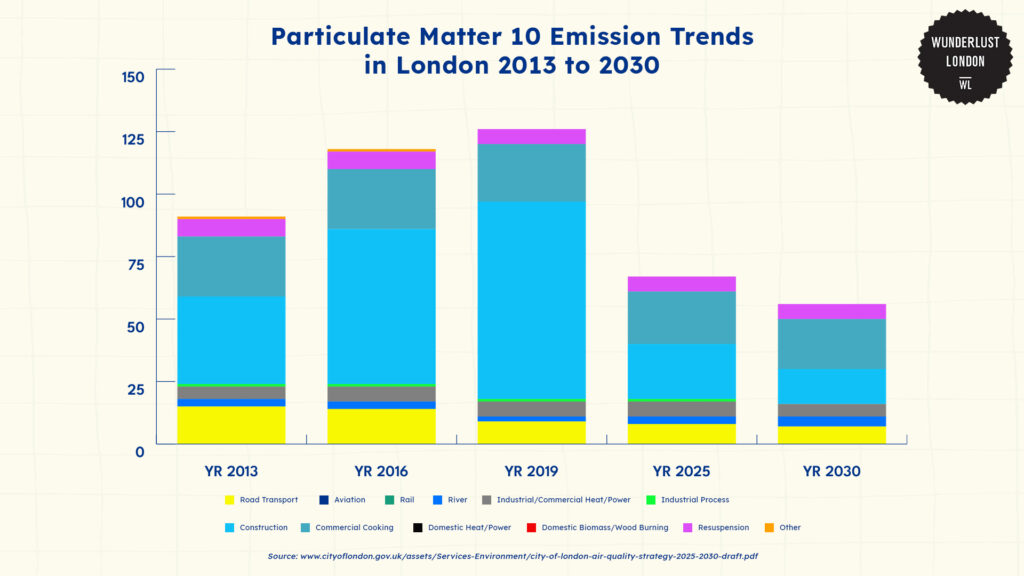
The bar graph here is based on data collected by City of London. It shows particulate matter pollution emissions with a diameter of 10.
The projections for 2025 and 2030 show a dramatic overall reduction in PM10 emissions, with total levels dropping to approximately 60 kilotonnes by 2030 – less than half of the 2019 peak.
The total PM10 emissions peaked around 2019 at approximately 125 kilotonnes before decreasing.
Construction was the largest single contributor to PM10 emissions, accounting for roughly 60-70% of total emissions during 2013-2019. By 2030, construction emissions are projected to decrease substantially, potentially by more than 50% from their peak.
Road transport and industrial processes each contribute smaller but consistent portions – approximately 10-15% of total emissions.
Domestic sources, including biomass/wood burning and heat/power make up roughly 15-20% of emissions. Interestingly, while overall emissions decrease, these domestic sources maintain a relatively stable proportion of the total through 2030.
London air pollution demographics
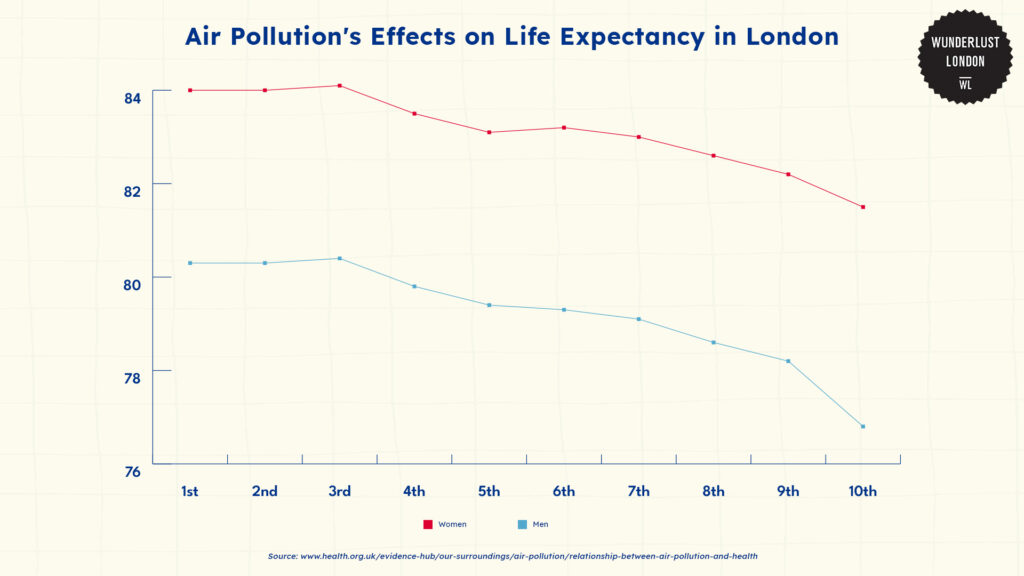
Based on the data by the Health Foundation, the graph above shows the relations between air pollution and life expectancy in London.
Women have higher life expectancy than men across all pollution levels. Women’s life expectancy ranges from approximately 84-86 years, and men’s range from about 79-82 years.
In the least polluted areas (1st decile), life expectancy is high about 85 years for women and 81 years for men.
As pollution increases, there’s a downward trend in life expectancy for both groups until the 9th decile, where life expectancy rises again.
Health implications of air pollution in London
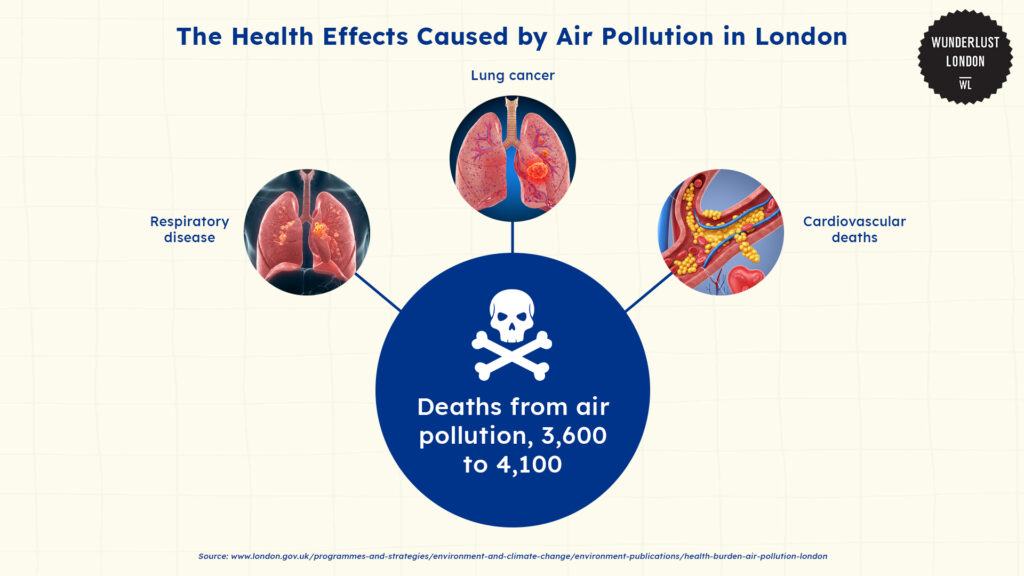
The UK government stated that in 2019, the equivalent of between 3,600 and 4,100 deaths were estimated to be attributable to air pollution in Greater London. The deaths are from causes related to bad air quality, like respiratory, lung cancer and cardiovascular deaths.
According to London City Hall, the highest number of deaths was in outer London boroughs. This is because of the higher proportion of elderly people in these areas, who are more vulnerable to the impacts of air pollution.
The City of London states that exposure to air pollution has a range of health impacts. Short-term exposure affects people with an existing condition like asthma, which is aggravated by high levels of air pollution.
The research also states that nitrogen dioxide emissions contribute to hospital admissions, asthma, decrease in lung function and more.
Policies and measures addressing London’s air quality
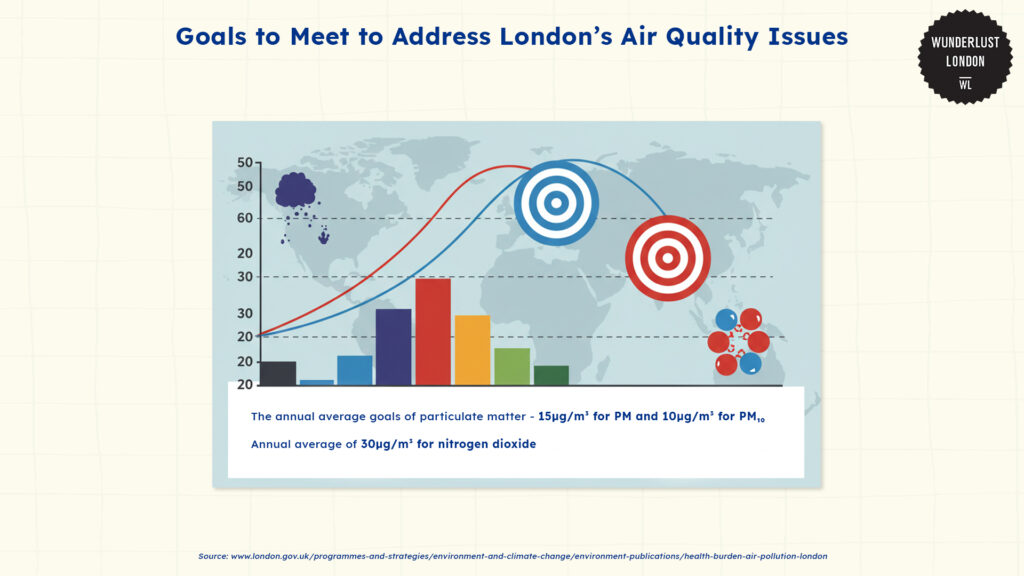
Based on policies stated in reports by The City of London, London aims to achieve healthy air quality by 2030. Their main goal is to have over 90% of the Square Mile meet an annual average of 30μg/m³ for nitrogen dioxide by 2030.
According to the London’s Air Quality Strategy, for particulate matter, they’ve set two important targets: an annual average of 15μg/m³ for PM₂.₅ and 10μg/m³ for PM₁₀ by 2030.
Based on reports from The City of London, progress toward these air quality goals will be monitored through annual reports.
Tackling transport emissions in London
Based on the City of London’s Air Quality Strategy, London is going to tackle transport emissions by tackling car idling.
According to The City of London, London has a differential parking charging system where electric or hybrid vehicles pay less (£5.00 on-street) compared to petrol vehicles (£7.20) and “other vehicles” (£10.00).
As a result, The City of London says that since 2015, air quality has improved with nitrogen dioxide levels down 50% by 2023. This was the first year all monitoring sites were below the national annual mean.
The City of London also says that London has completed several successful transport redesigns, including closing Aldgate Gyratory and transforming Aldgate Square. Bank on Safety and All Change at Bank have made the junction safer and more pleasant for pedestrians.
These show London is serious about improving air quality through pricing, traffic management and enforcing against polluting behaviours.
References
- Relationship between air pollution and health. (2024). The Health Foundation. https://www.health.org.uk/evidence-hub/our-surroundings/air-pollution/relationship-between-air-pollution-and-health
- Air quality monitoring. (n.d.). City of London. https://www.cityoflondon.gov.uk/services/environmental-health/air-quality/air-quality-monitoring
- City of London Corporation, & Durcan, M. (2025). Air Quality Strategy 2025 – 2030. https://www.cityoflondon.gov.uk/assets/Services-Environment/city-of-london-air-quality-strategy-2025-2030-draft.pdf
- Environmental Research Group, Imperial College London. (n.d.). London Air Quality Network Guide. https://www.londonair.org.uk/londonair/guide/ActionsOverview.aspx
- Health burden of air pollution in London. (2021, January 25). London City Hall. https://www.london.gov.uk/programmes-and-strategies/environment-and-climate-change/environment-publications/health-burden-air-pollution-london
- Health impacts. (n.d.). City of London. https://www.cityoflondon.gov.uk/services/environmental-health/air-quality/health-impacts
- Pollution and air quality. (n.d.). London City Hall. https://www.london.gov.uk/programmes-and-strategies/environment-and-climate-change/pollution-and-air-quality/
- The World Air Quality Index project. (n.d.). London Air pollution: Real-time air quality index. aqicn.org. https://aqicn.org/city/london/