
Key insights
- The 2021 UK census confirms that London is England and Wales’s most ethnically diverse region.
- According to the Office for National Statistics (ONS), the “White” ethnic group remains the largest.
- ONS reports that Bromley, Barnet, and Wandsworth boroughs have the highest white ethnic group population.
- A survey by London of Chamber of Commerce and Industry found that most ethnic minority entrepreneurs, including Black and Asian, are based in Greater London at a higher rate than White entrepreneurs.
- Trust for London data shows that London’s population will continue to grow, though at a slower rate than the rest of England.
- Mayor Sadiq Khan has created policies to support the city’s diverse ethnic communities.
According to the 2021 census conducted by the United Kingdom government, London stands out as the most ethnically diverse region in England and Wales.
To provide a clearer picture of how diverse London is, the following data reveals the 2021 ethnicities percentage in London.
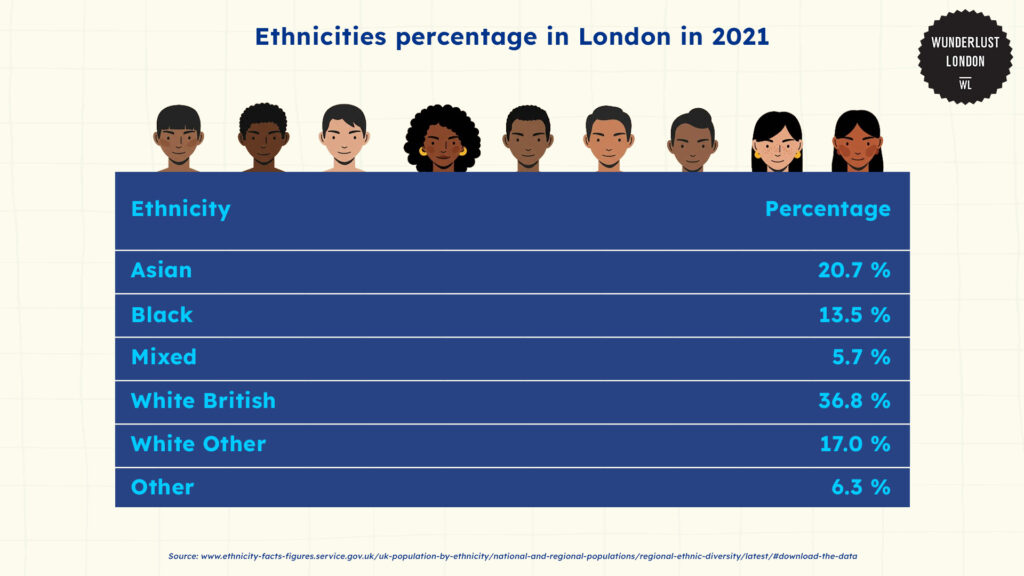
The data revealed that 46.2% of London’s residents identified with Asian, black, mixed, or ‘other’ ethnic groups.
In addition to this, another 17.0% identified with white ethnic minorities, further emphasising the city’s rich cultural diversity.
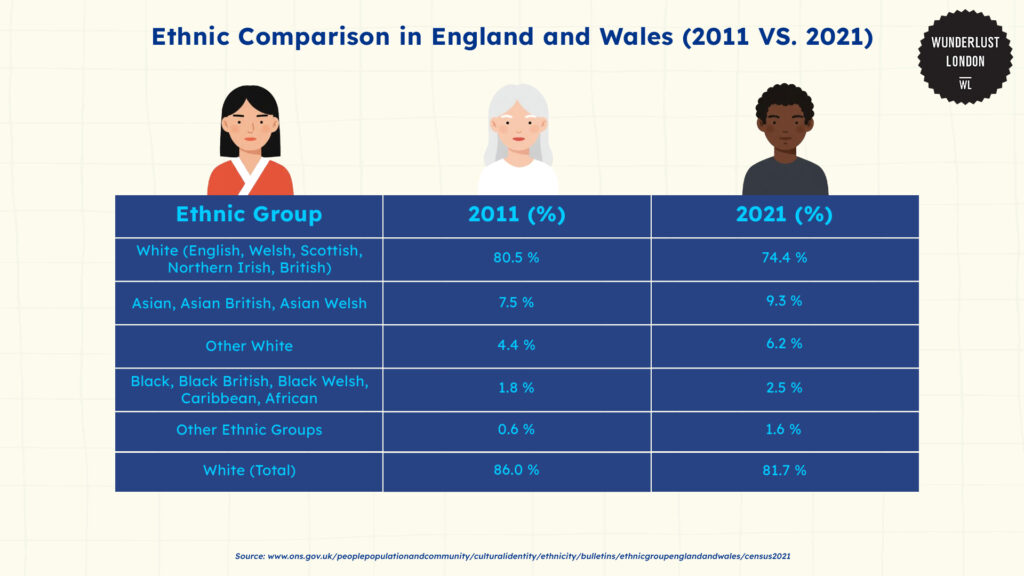
According to the Office for National Statistics (ONS), the “White” ethnic group remains the largest, but it has decreased over time.
In 2021, 81.7% of people identified as White, which decreased from 86.0% in 2011.
Even though the total number of people in this category increased slightly (from 48.2 million to 48.7 million), the overall percentage dropped because the population grew.
Within the White category, the group identifying as “English, Welsh, Scottish, Northern Irish or British” also declined. This steady decrease may reflect cultural shifts, immigration, and more people choosing different labels for their identity.
Other key changes include the increase in people identifying as “Other ethnic group” and those identifying as “Black, Black British, Black Welsh, Caribbean or African: African.”
ONS noted that both groups had the option to write in their specific background. This may have encouraged them to be more detailed with their self-identification.
Historical trends in London’s ethnic diversity
GOV.UK discussed that the data on ethnicity was collected using a standardised list of 19 ethnic groups in the 2021 consensus. It was slightly different from the groups listed in the 2011 census.
The updates were made to better represent diverse communities.
One major change was adding the ‘Roma’ group under the broader ‘white’ ethnic category. This gives better recognition of the Roma community, which had previously been grouped more generally.
Another update allowed people in the ‘black African’ ethnic group to write in their specific background in their own responses.
This change gave individuals more freedom to identify with their cultural or national identities to ensure a clearer picture of the population’s diversity.
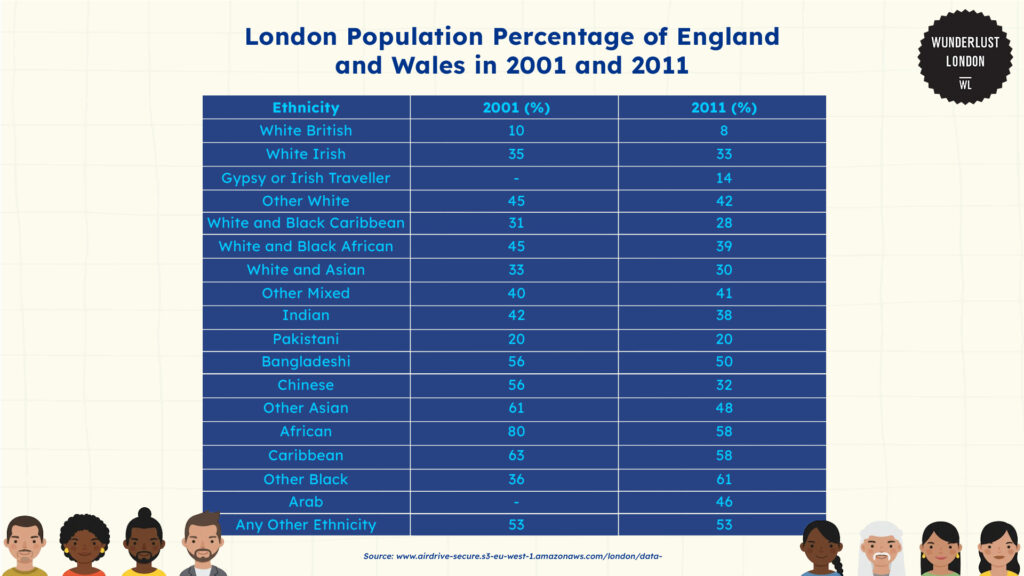
Comparing the data gathered by the Census Information Scheme, London became more diverse in the ethnic landscape between 2001 and 2011.
The proportion of White British and White Irish populations decreased, with White British dropping from 10% to 8% and White Irish falling from 35% to 33%.
This suggests that these traditionally dominant groups made up a smaller share of London’s population compared to England and Wales over the decade.
At the same time, some minority groups also experienced changes.
The “African” and “Caribbean” populations declined, while the “Other Black” category grew from 36% to 61%. This increase may be because of the shifting of identity preferences or migration patterns from different parts of Africa and the Caribbean.
Ethnic demographics in London compared to other countries in the UK
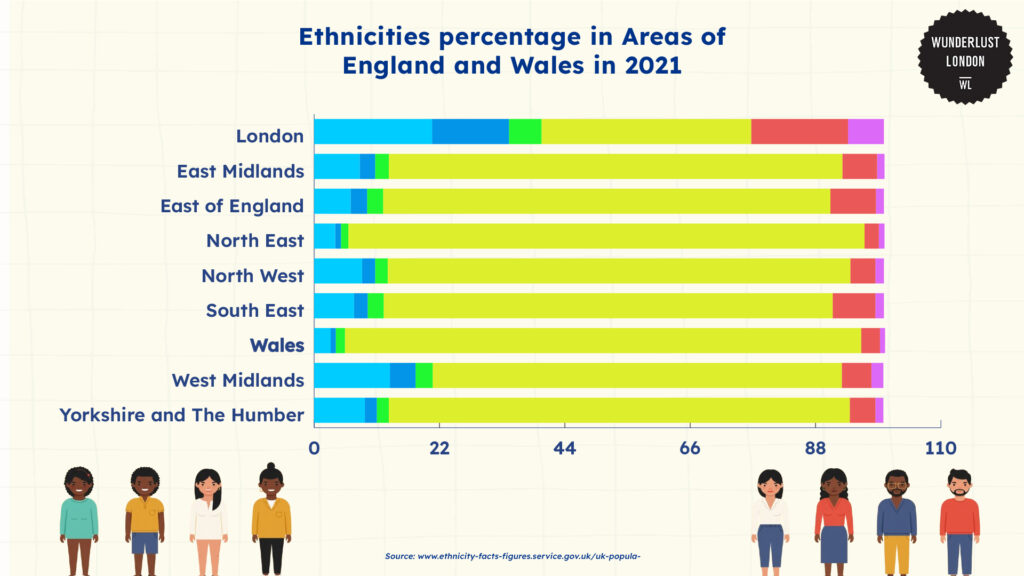
Compared to the other areas in England and Wales, the United Kingdom government found North East to be the least ethnically diverse region.
Only 7.0% of its residents identified with Asian, black, mixed, or ‘other’ ethnic groups, and just 2.4% identified with white ethnic minorities.
This significant difference highlights the varying demographic makeup across different parts of the UK.
When it comes to individuals identifying as white British, the North East and Wales recorded the highest percentages, both at 90.6%.
On the other hand, London had the lowest proportion of white British residents, with just 36.8%.
These figures reflect the unique character of each region. While London thrives as a multicultural hub, other areas maintain a more homogenous population.
Ethnic distribution across London boroughs and key influences
White Ethnic Group Distribution Across London Boroughs
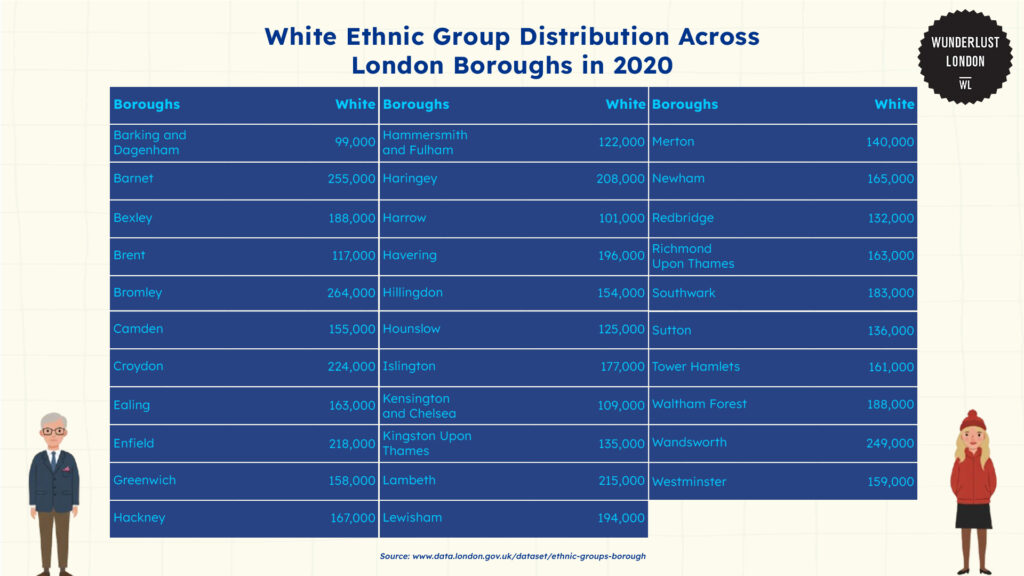
ONS presented this data, which shows the distribution of the White ethnic group across London boroughs in 2020.
Bromley, Barnet, and Wandsworth had the highest White populations, each with over 240,000 residents.
Conversely, boroughs such as Harrow, Barking and Dagenham, and Kensington and Chelsea had much lower White ethnic group populations, each below 110,000.
This suggests that larger suburban areas, like Bromley and Barnet, tend to have larger White populations. Meanwhile, inner-city areas like Kensington and Chelsea have a smaller share.
Asian Ethnic Group Distribution Across London Boroughs
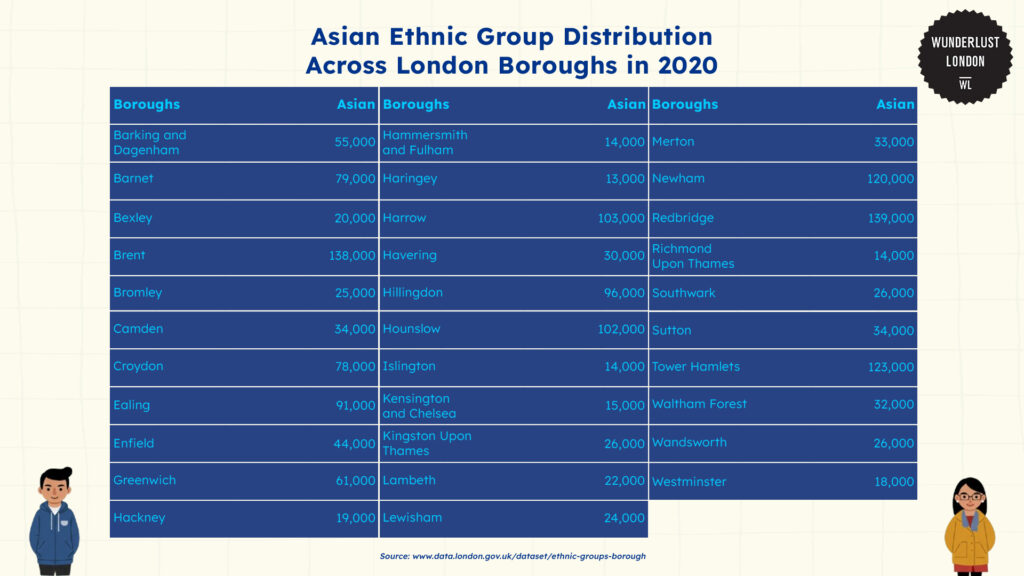
The Asian ethnic population in London is concentrated in certain boroughs.
ONS data shows that Redbridge, Brent, and Tower Hamlets have some of the highest numbers. This os driven by migration, particularly from South Asia.
According to the government of Tower Hamlets, the borough has seen rapid growth over the past decade, with international migration accounting for nearly 75% of the increase.
It’s home to a diverse community, including many from Bangladesh, India, and other countries. It also has one of the highest numbers of short-term migrants in London, many of whom are students.
Conversely, boroughs like Haringey, Islington, and Kensington and Chelsea have some of the lowest Asian populations. These areas have higher property prices or different historical migration patterns, which may have contributed to lower Asian community settlements.
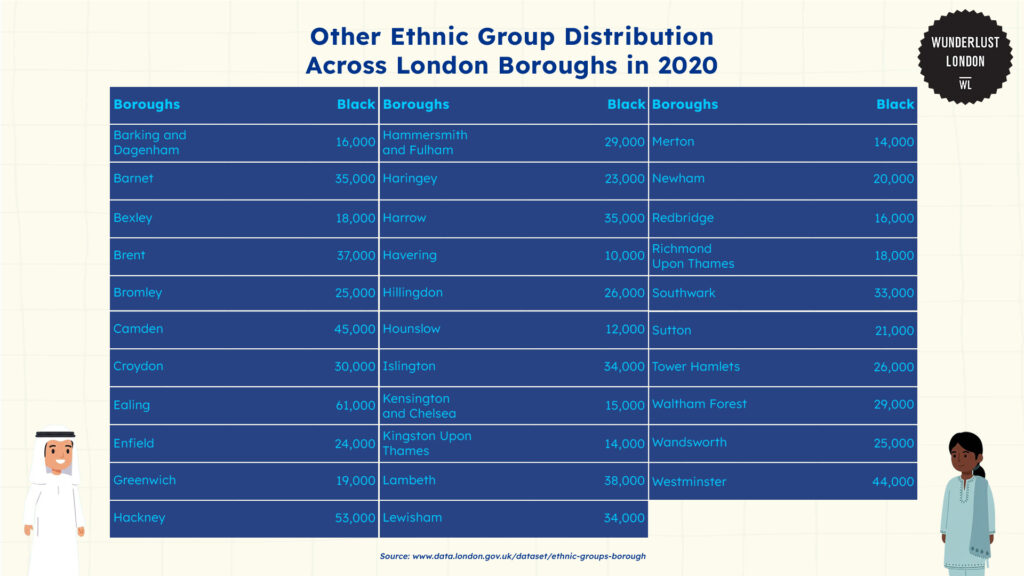
Black Ethnic Group Distribution Across London Boroughs
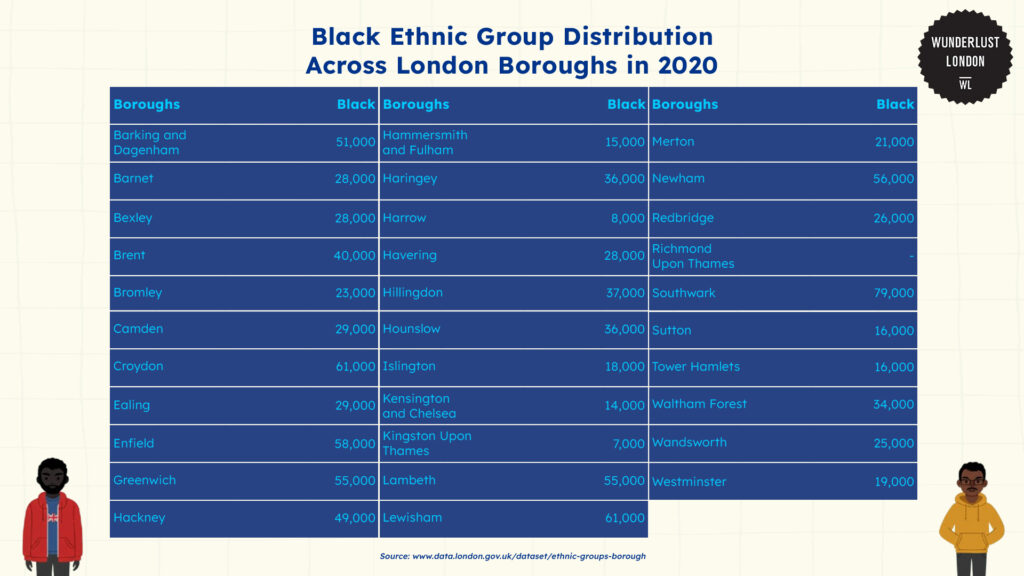
According to ONS data, boroughs such as Southwark, Lewisham, Croydon, and Newham have some of the highest numbers of Black residents.
A 2014 report noted that migration from Africa and the Caribbean, particularly in the post-war period, has shaped these areas.
Southwark stands out as having the largest Black population, with 79,000 residents. It’s followed by Lewisham and Croydon, each with 61,000.
Other boroughs, such as Greenwich, Lambeth, and Newham, also have significant Black populations. Many of these areas have strong cultural ties to the Windrush generation.
Other Ethnic Group Distribution Across London Boroughs
The distribution of the Mixed/Other ethnic group across London boroughs highlights a diverse and growing population.
Data from ONS demonstrates that boroughs such as Ealing, Hackney, and Westminster have some of the highest numbers within this category.
This group includes people of mixed heritage and smaller ethnic communities that do not fit into the broader White, Black, or Asian categories.
The presence of large international communities, students, and professionals in the central boroughs, like Westminster, contributes to the higher numbers there.
Socioeconomic implications of London’s ethnic diversity
London has the largest ethnic minority population in the UK. This diversity is also seen in business, as the city has the highest concentration of ethnic minority entrepreneurs in the country.
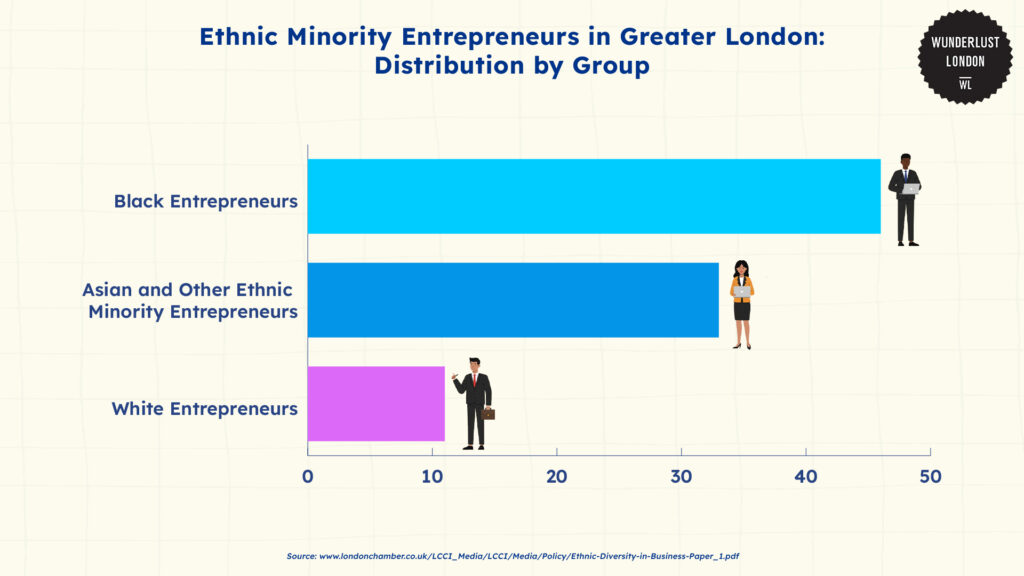
A survey by London of Chamber: Commerce and Industry found that nearly half (46%) of Black entrepreneurs and 33% of Asian and other ethnic minority entrepreneurs are based in Greater London, compared to just 11% of White entrepreneurs.
Despite the city’s diversity, many Black and Asian entrepreneurs struggle to succeed in growing their businesses. According to London of Chamber, they often work in lower-growth sectors like food, personal care, and communication, rather than high-growth sectors like tech or finance.
This makes it harder for their businesses to expand, creating a cycle where both ethnicity and location limit opportunities.
However, despite these challenges, MSDUK reported that these ethnic minority-led businesses still make a major impact. They contribute between £25 billion and £74 billion to the UK’s economy each year.
Future projections and emerging trends in London’s ethnic demographics
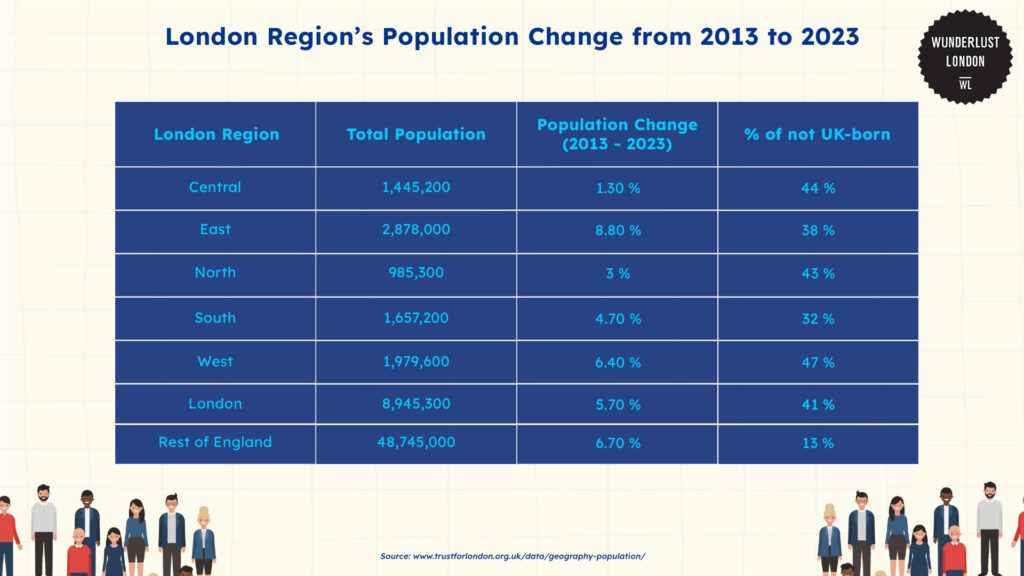
Data from Trust for London shows that London’s population will continue to grow, though at a slower rate than the rest of England.
The East and West regions of London saw the highest growth between 2013 and 2023. However, Central London grew much more slowly.
This suggests that more people are choosing to live in outer London areas. The East and West of London are likely to keep growing, especially since these areas attract more residents, including migrants.
In contrast, Central London’s slower growth may be attributed to high living costs and limited space for new housing developments.
London is also expected to become even more diverse as the population increases.
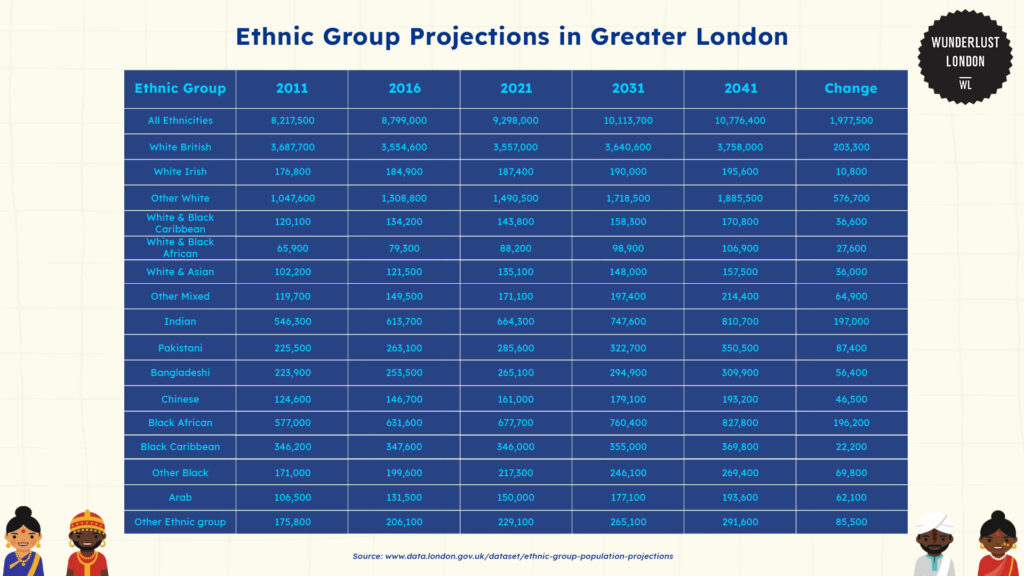
The Greater London Authority (GLA) also produced projections for ethnic groups in 2016 based on housing-led estimates.
The White British population is expected to remain relatively stable. However, the Other White group (which includes European and other international migrants) could grow from 1.05 million in 2011 to 1.88 million in 2041.
Other ethnic groups are also likely to grow steadily, making London even more diverse.
Social and economic impacts of London’s future demographic shifts
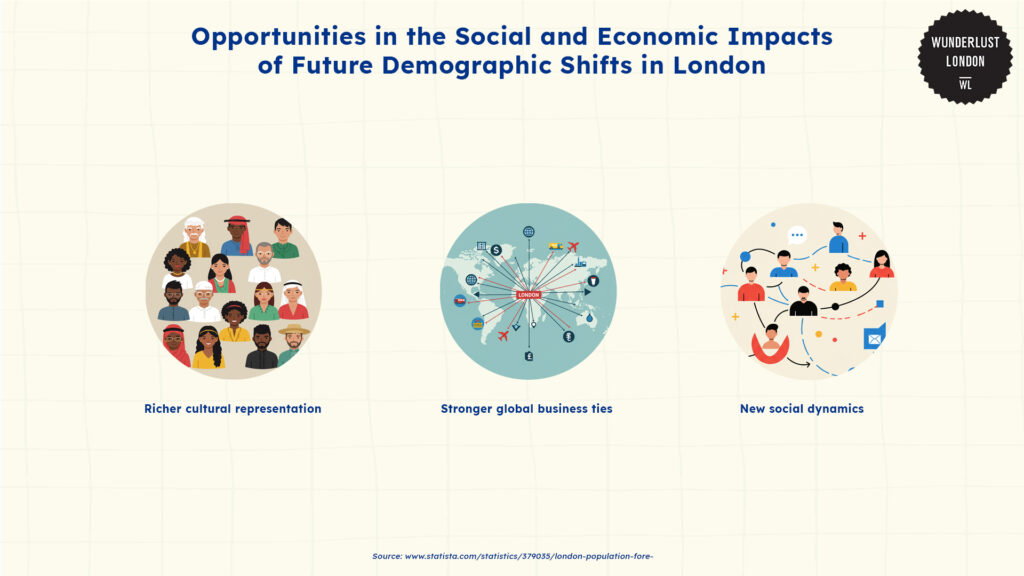
London’s evolving demographics will bring both opportunities to the city. A richer mix of cultures will influence food, music, and arts.
Stronger global ties are another benefit. Statista reveals that London is already contributing around 25 % of the UK’s gross domestic product (GDP).
A diverse workforce can attract international investors and businesses, which can help the city thrive in global trade.
Additionally, a culturally diverse population can also drive innovation and creativity in the technology and arts industries.
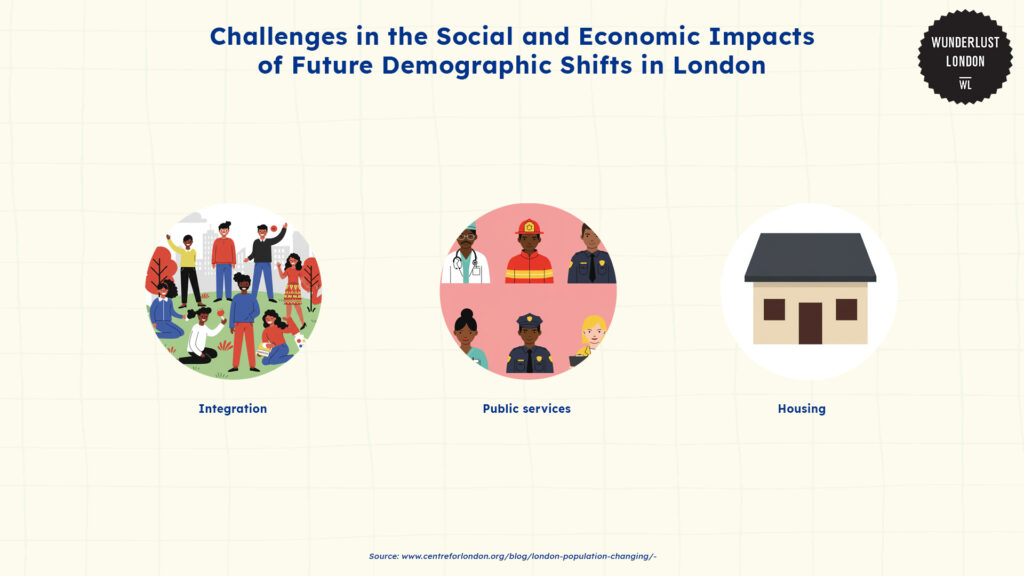
However, there are also challenges. London has a strong identity, but according to Centre for London, integrating new residents into local communities remains critical to maintaining harmony.
Language barriers and cultural differences can lead to inequalities. Public services such as healthcare, education, and transportation are also likely to struggle to keep up with the increased demand from a growing population.
With such a rapid increase in population, London’s housing demand will also continue to rise, affecting both affordability and infrastructure planning.
Ned Bank Private Wealth predicts that in 2025, house prices could rise by about 4%, while rental prices may grow by around 3%.
Policy measures of London to support a diverse population
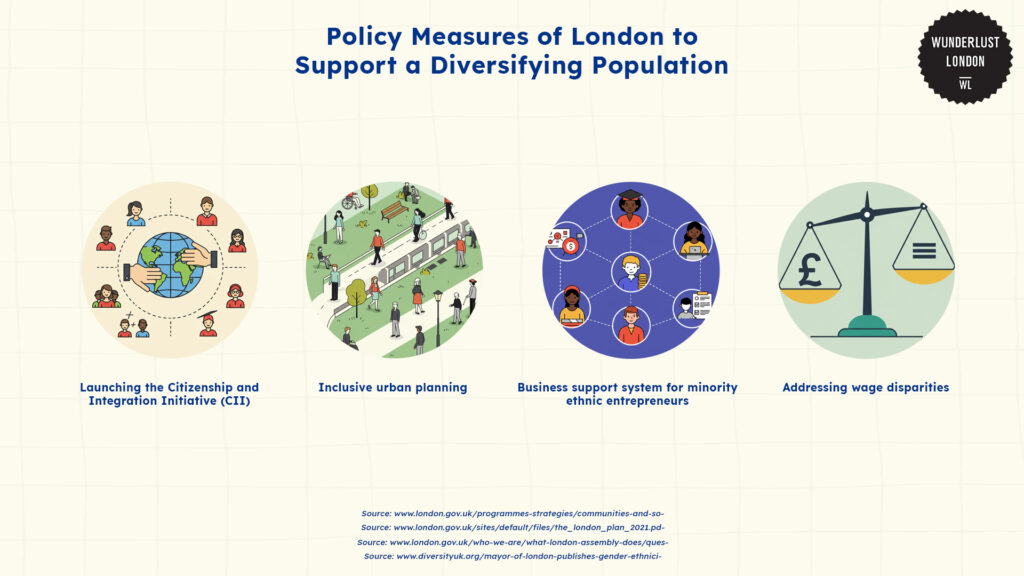
Mayor Sadiq Khan has created policies to support the city’s diverse ethnic communities.
One key effort is the Citizenship and Integration Initiative (CII), launched in 2017. This initiative helps migrants and refugees become active citizens by promoting voter registration and providing legal support to those with uncertain immigration status.
The London Plan also prioritises affordable housing, ensures public spaces are safe and accessible for everyone, and improves public transport. One of its goals is to create neighbourhoods where people from different backgrounds can connect and thrive.
On the business side, the Greater London Investment Fund (GLIF) invested £20 million to support under-represented businesses, including those led by ethnic minorities.
Additionally, the Greater London Authority group has developed Transport for London. It has a new four-year Pay Gap Action Plan to reduce gender and ethnicity pay gaps. It promotes diversity and inclusion, including anonymous job applications to reduce bias.
References
- An outlook on the 2025 UK property market. Nedbank Private Wealth. (2025). https://nedbankprivatewealth.com/insights/an-outlook-on-the-2025-uk-property-market/
- A profile of the migrant population in Tower Hamlets. Tower Hamlets. (2017). https://www.towerhamlets.gov.uk/Documents/Borough_statistics/Diversity/A_Profile_of_the_Migrant_Population_in_Tower_Hamlets.pdf
- Agubretu, E. (n.d.). Ethnic diversity in business. London of Chamber: Commerce and Industry. https://www.londonchamber.co.uk/LCCI_Media/LCCI/Media/Policy/Ethnic-Diversity-in-Business-Paper_1.pdf
- Belcher, E. (2018). Five maps showing how London’s population is changing. Centre for London. https://centreforlondon.org/blog/london-population-changing/
- Citizenship and integration initiative (CII) | London City Hall. Mayor of London: London Assembly. (n.d.). https://www.london.gov.uk/programmes-strategies/communities-and-social-justice/migrants-and-refugees/citizenship-and-integration-initiative-cii
- Clark, D. (2024). London population forecast 2043 | statista. Statista. https://www.statista.com/statistics/379035/london-population-forecast/
- Demography, London’s Population & Geography. Trust for London. (2024). https://trustforlondon.org.uk/data/geography-population/
- Ethnic-minority-led businesses make 74bn annual contribution to UK economy. MSDUK. (2023). https://www.msduk.org.uk/news/ethnic-minority-led-businesses-make-74bn-annual-contribution-to-uk-economy/
- Garlick, S. (2022). Ethnic Group, England and Wales: Census 2021. Ethnic group, England and Wales – Office for National Statistics. https://www.ons.gov.uk/peoplepopulationandcommunity/culturalidentity/ethnicity/bulletins/ethnicgroupenglandandwales/census2021
- GLA Demography. (2022). Ethnic Group Population Projections. London Data Store. https://data.london.gov.uk/dataset/ethnic-group-population-projections
- GLA Intelligence. (n.d.). Amazonaws. Census Information Scheme. https://airdrive-secure.s3-eu-west-1.amazonaws.com/london/dataset/cis-commissioned-2011-census-tables/2018-03-29T10:40:16/CT0257%20age%20x%20accom%20x%20bedrooms.xlsx?X-Amz-Algorithm=AWS4-HMAC-SHA256&X-Amz-Credential=AKIAJJDIMAIVZJDICKHA/20240712/eu-west-1/s3/aws4_request&X-Amz-Date=20240712T170425Z&X-Amz-Expires=300&X-Amz-Signature=2c15c0a136af6265d114410a237356bf8a7ab115e26bc8324c7ca311b6a59e65&X-Amz-SignedHeaders=host
- Greater London Investment Fund | London City Hall. The Mayor of London. (2019). https://www.london.gov.uk/who-we-are/what-london-assembly-does/questions-mayor/find-an-answer/greater-london-investment-fund
- Kochan, B. (2014). Migration and London’s growth. The London School of Economics and Political Science. https://www.lse.ac.uk/geography-and-environment/research/lse-london/documents/Books/full-book-migrationandlondonsgrowth.pdf
- The London Plan. The Mayor of London. (2021). https://www.london.gov.uk/sites/default/files/the_london_plan_2021.pdf
- Mayor of London publishes gender, Ethnicity & Disability pay Gap Data. Diversity UK. (2022). https://diversityuk.org/mayor-of-london-publishes-gender-ethnicity-disability-pay-gap-data/
- Office for National Statistics. (2022). Ethnic groups by Borough. London Data Store. https://data.london.gov.uk/dataset/ethnic-groups-borough
- Office for National Statistics. (2022). Regional ethnic diversity. GOV.UK Ethnicity facts and figures. https://www.ethnicity-facts-figures.service.gov.uk/uk-population-by-ethnicity/national-and-regional-populations/regional-ethnic-diversity/latest/#download-the-data