
Key Insights
- The Greater London Authority (GLA) reported that 1 in 4 British adults face a diagnosable mental disorder each year.
- According to the London Data Store, neurotic disorders affect 182.1 out of every 1,000 people.
- Data from the Office for National Statistics (ONS) in 2012/13 showed that London residents report lower well-being and higher stress than the UK average.
- London Data Store reported that inner-city boroughs like Hackney, Islington, and Lambeth have the highest neurotic disorder rates compared to other London boroughs.
- The 2014 Adult Psychiatric Morbidity Survey found that mental health symptoms are more common in younger and middle-aged adults, with severe cases peaking in those aged 45-54.
- In 2013, the GLA reported that conduct disorder was the most common mental diagnosis among children aged 5 to 16 in London.
- NHS England data showed that common mental disorders (CMD) are more prevalent in women than in men.
- GOV.UK reported that Black individuals consistently have the highest rates of Mental Health Act detentions in four years.
- GLA estimated that mental ill health costs London over £26 billion in economic and social impacts.
- Thrive LDN was launched by the Mayor and led by the London Health Board to improve mental well-being in London.
Prevalence of mental health issues in London
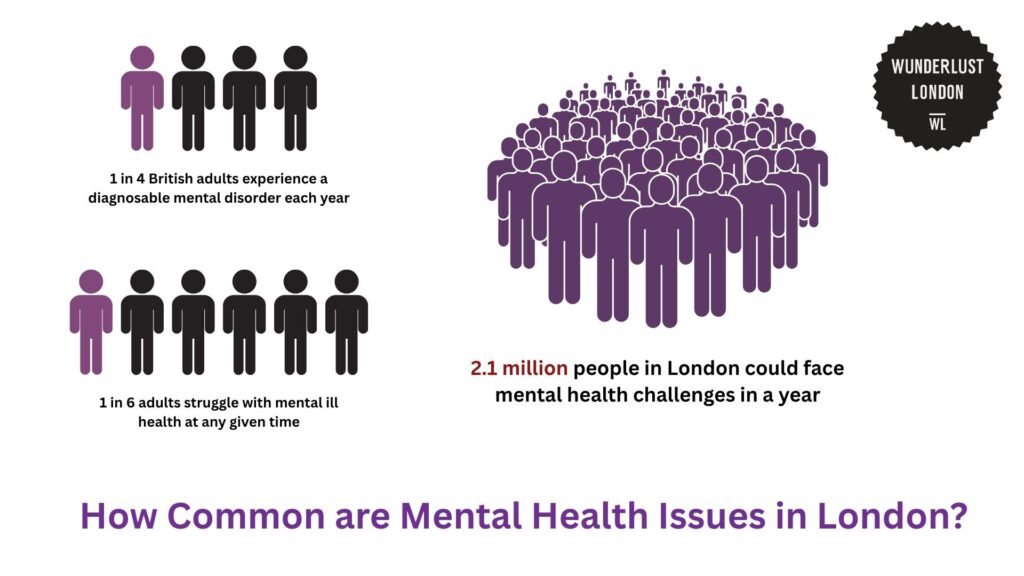
According to the Greater London Authority (GLA), mental health issues affect a significant portion of the population.
Each year, 1 in 4 British adults experience at least one diagnosable mental disorder, while 1 in 6 adults experience mental ill health at any given time.
With London’s estimated population at 8.4 million in 2013, this suggests that around 2.1 million people could experience clinical levels of mental ill health in a year.
However, the actual number is harder to determine due to factors like age, gender, and lifestyle. Some individuals may experience more than one mental disorder at the same time or at different stages of life.
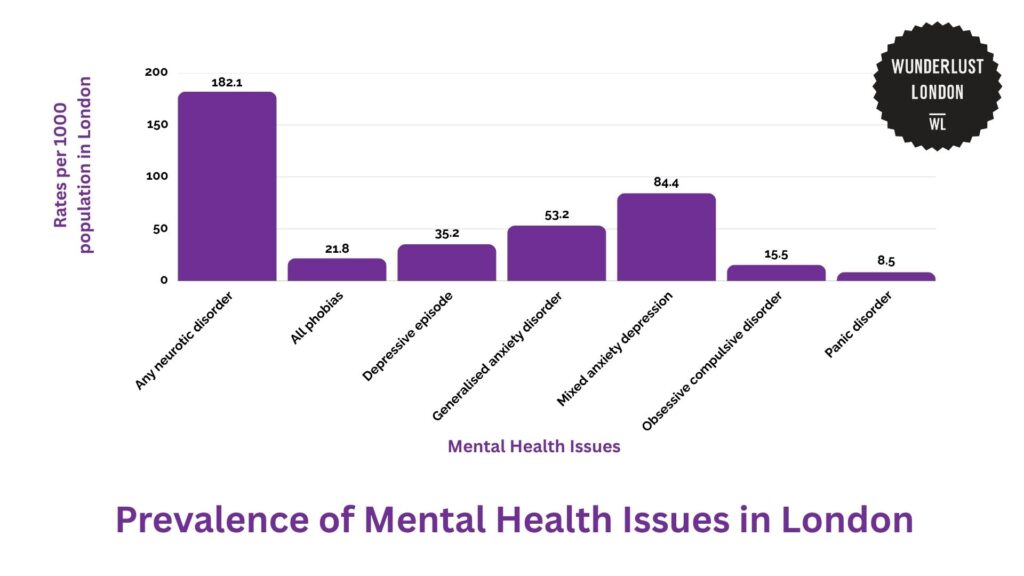
London Data Store provided a breakdown of various mental health conditions in the city. The biggest number is for neurotic disorders, which affect 182.1 out of every 1,000 people.
This category already includes conditions such as anxiety, depression, and related disorders. This just means many Londoners are struggling with their mental health.
Among specific conditions, mixed anxiety and depression are the most common. Many people experience both at the same time too.
Generalised anxiety disorder and depressive episodes also affect a lot of people. However, other conditions like phobias, obsessive-compulsive disorder, and panic disorder are less common but still impact many.
London’s mental health statistics in comparison with national averages
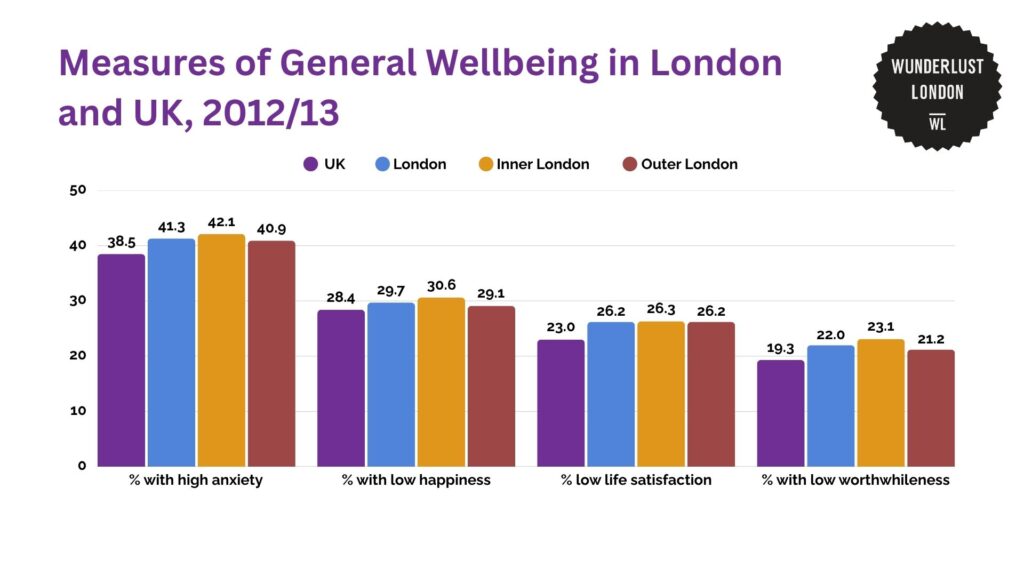
Data from the Office for National Statistics in 2012/13 shows that many people living in London reported worse well-being compared to the UK average across all measures. Londoners experience high levels of stress and low well-being, even without a clinical diagnosis.
London has the highest anxiety levels in the UK, with 41.3% of adults reporting high anxiety, compared to the national average of 38.5%. Anxiety is more common in Inner London than Outer London too.
Life satisfaction and feelings of low worthwhileness follow the same pattern. They’re much lower compared to the rest of the UK. The fast-paced environment, high living costs, and social pressures of city life likely contribute to this trend.
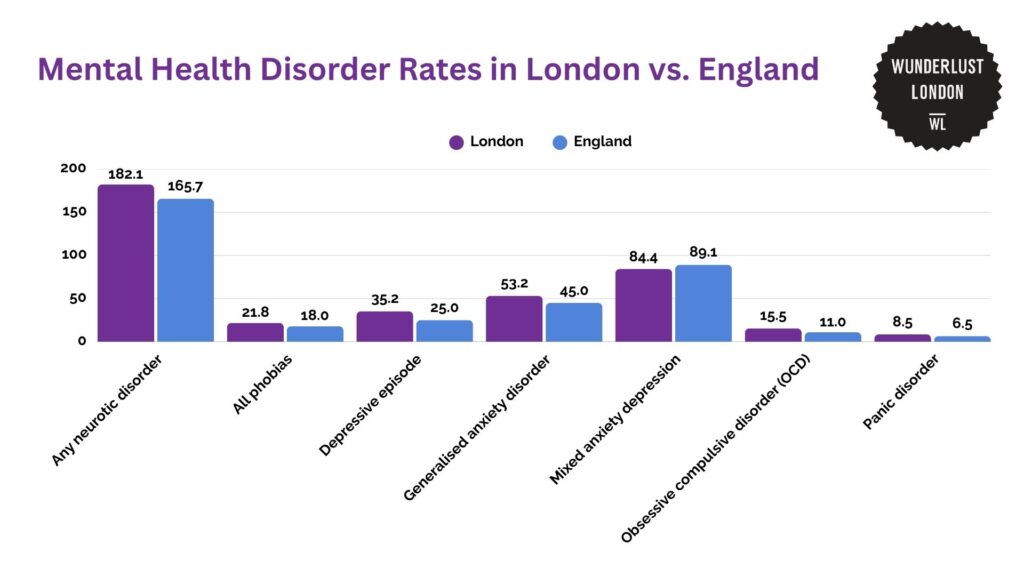
The London Data Store provided some data to compare the mental health issues experienced in London and England as a whole. Disorders like depression, anxiety, OCD, and panic disorder all have higher rates in the capital.
One of the biggest differences is in depressive episodes, which are more common in London. Generalised anxiety disorders are also more widespread, which could point to higher levels of stress in the city.
Interestingly, mixed anxiety and depression is one of the few categories where England has a slightly higher rate than London.
This could mean that while anxiety and depression individually are more common in London, the combined diagnosis is more frequent across the country.
Mental health disorders in London by boroughs
Neurotic disorders in London boroughs
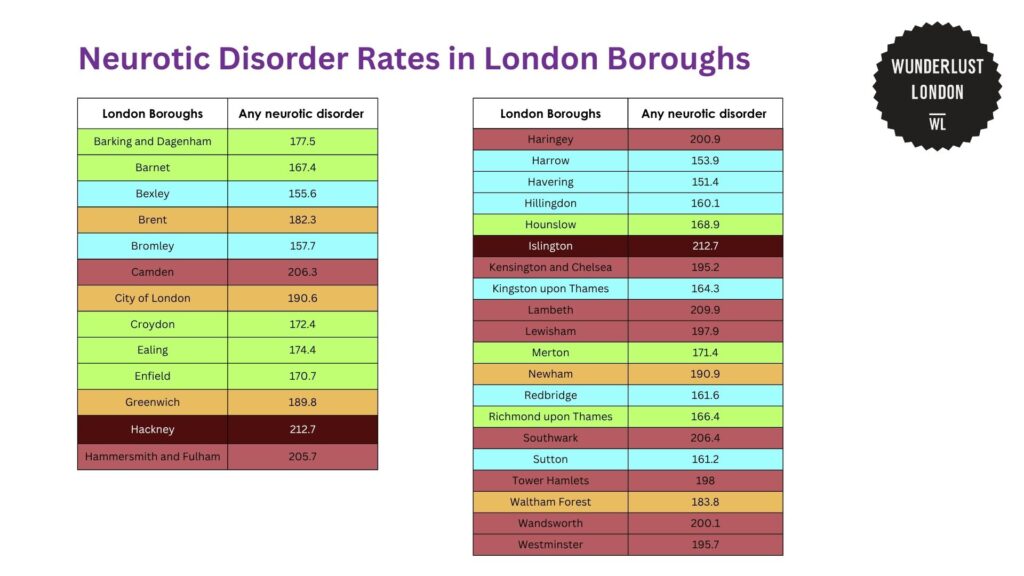
Based on the report by the London Data Store, inner-city boroughs such as Hackney, Islington, and Lambeth have the highest rates of neurotic disorders. All three exceeded 209 cases per 1,000 people.
This trend suggests that urban environments with high population density, fast-paced lifestyles, and economic pressures may contribute to increased mental health struggles.
Similarly, boroughs like Southwark (206.4) and Hammersmith & Fulham (205.7) also follow this pattern. This reinforces the idea that central London areas experience higher levels of neurotic disorders compared to outer areas.
In contrast, outer boroughs like Bexley, Harrow, and Havering report lower rates of neurotic disorders, about 150 cases per 1,000 people.
These areas tend to have more green spaces, less congestion, and possibly lower levels of socioeconomic stress. This could explain the lower prevalence of these conditions.
Depressive episodes in London boroughs
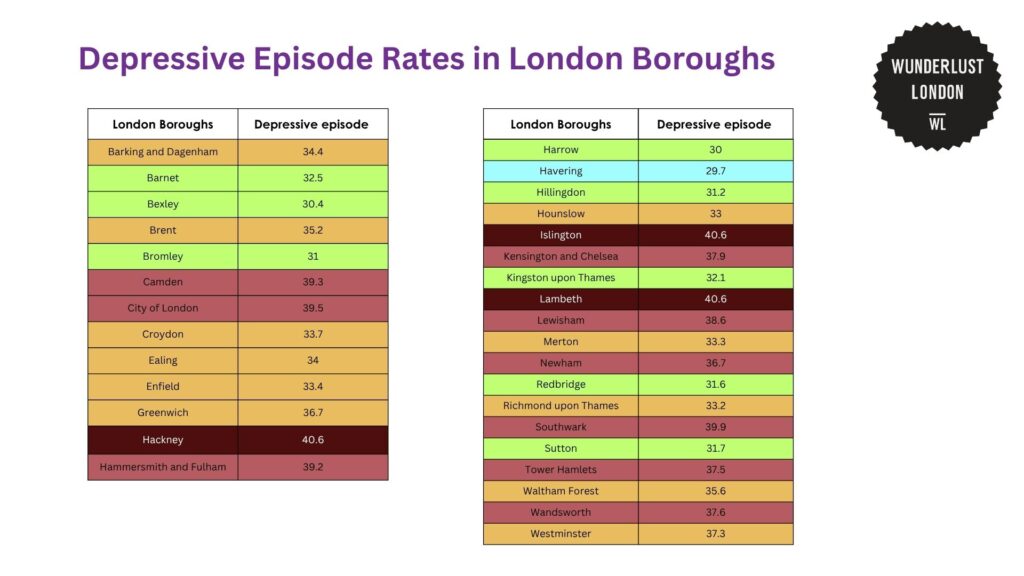
Findings from the London Data Store show that depression rates follow a similar pattern to neurotic disorders. Hackney, Islington, and Lambeth have the highest rates, with over 40 cases per 1,000 people.
These boroughs are known for their high cost of living and economic inequality, which may contribute to mental health struggles.
Outer boroughs like Havering, Harrow, and Bexley report much lower rates, closer to 30 per 1,000.
Some boroughs, like Brent, Greenwich, and Newham, have mid-range depression rates. This could mean that while these areas face city-related stress, they also have good community support or mental health services that help balance things out.
Generalised anxiety disorder in London boroughs
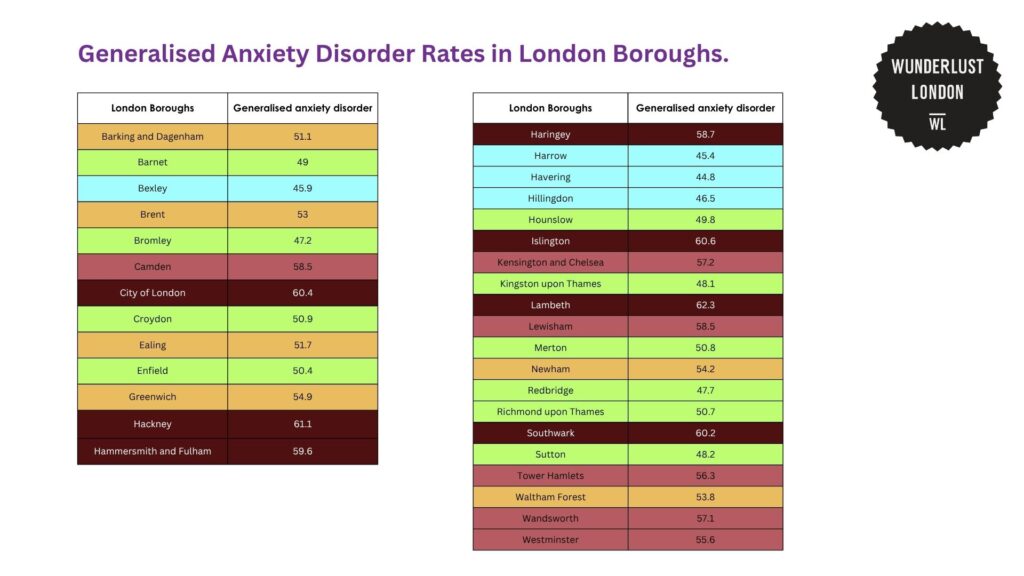
According to the London Data Store, anxiety rates are highest in boroughs like Hackney (61.1), Islington (60.6), and Lambeth (62.3). This mirrors the trends seen in depression and neurotic disorders.
The central boroughs’ high stress levels, expensive living conditions, and fast-paced lifestyles could be key contributors.
Meanwhile, boroughs like Harrow (45.4), Havering (44.8), and Bexley (45.9) report the lowest anxiety rates.
These areas are characterised by lower population densities and more tranquil environments. This may have provided a protective effect against chronic stress and anxiety.
Mixed anxiety depression in London boroughs
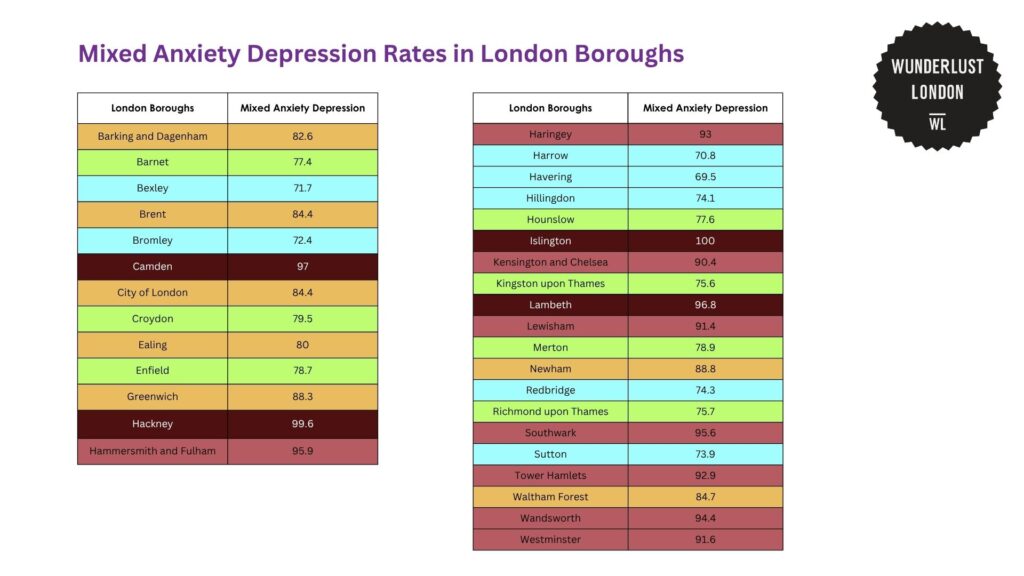
Data from London Data Store indicates that the highest rates of mixed anxiety and depression appear in boroughs like Islington (100.0), Hackney (99.6), Camden (97.0), and Lambeth (96.8). All of these boroughs are densely populated and experience economic disparities.
On the other end, boroughs like Havering (69.5), Harrow (70.8), Bexley (71.7), and Bromley (72.4) report lower rates. These areas tend to be more suburban and have lower population density.
Obsessive compulsive disorder
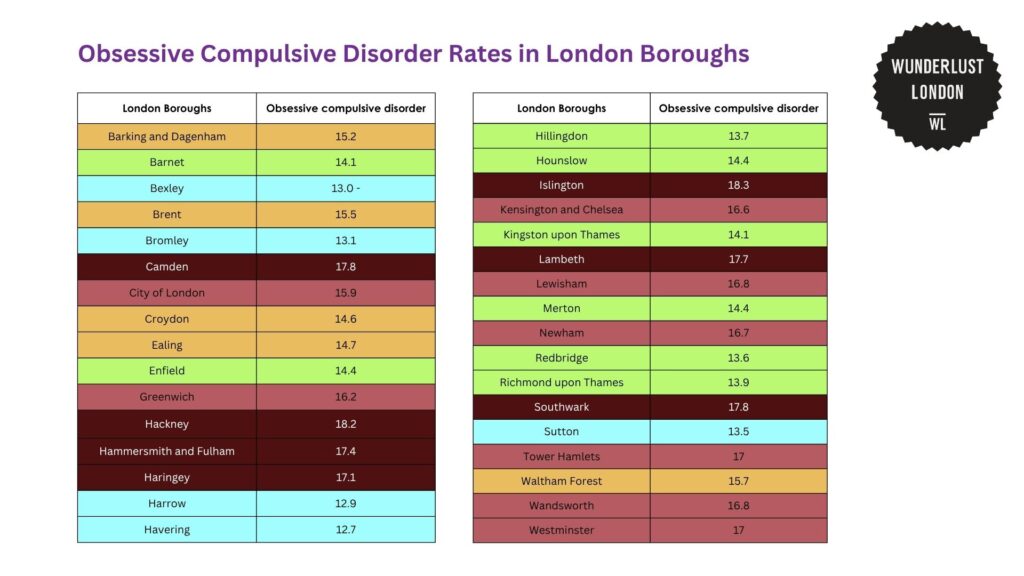
The London Data Store reported that the highest OCD rates in London are found in the boroughs of Islington (18.3), Hackney (18.2), Camden (17.8), and Southwark (17.8).
OCD is often linked to heightened stress, perfectionism, and environmental factors. All of which may be pronounced in fast-moving city environments.
Meanwhile, the boroughs with the lowest OCD rates—Havering (12.7), Harrow (12.9), and Bexley (13.0)—are typically suburban and may provide environments that help reduce the likelihood of OCD symptoms worsening.
Panic disorder
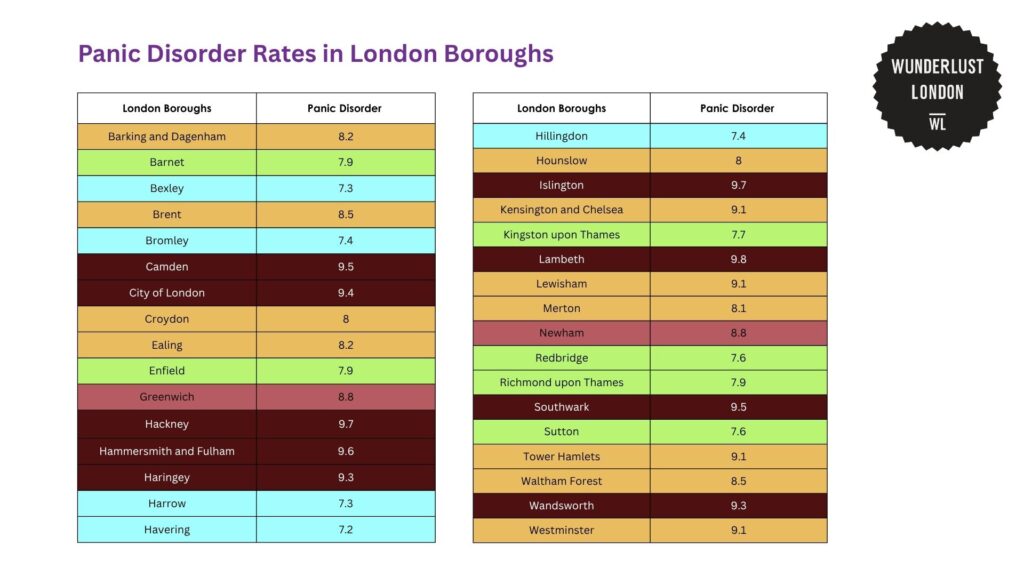
Panic disorder rates vary across London boroughs, and the London Data Store shared some insights about this.
The highest rates are in Lambeth (9.8), Hackney (9.7), Islington (9.7), and Hammersmith and Fulham (9.6). These boroughs share characteristics such as high pressure, financial stress, and a fast-moving lifestyle, which may contribute to panic attacks.
At the lower end of the scale, boroughs like Havering (7.2), Bexley (7.3), and Harrow (7.3) report the lowest panic disorder rates. Their quieter, more residential atmosphere could contribute to reduced triggers for panic-related conditions.
Demographic disparities of mental health disorders in London
Mental health disorders in London by age group
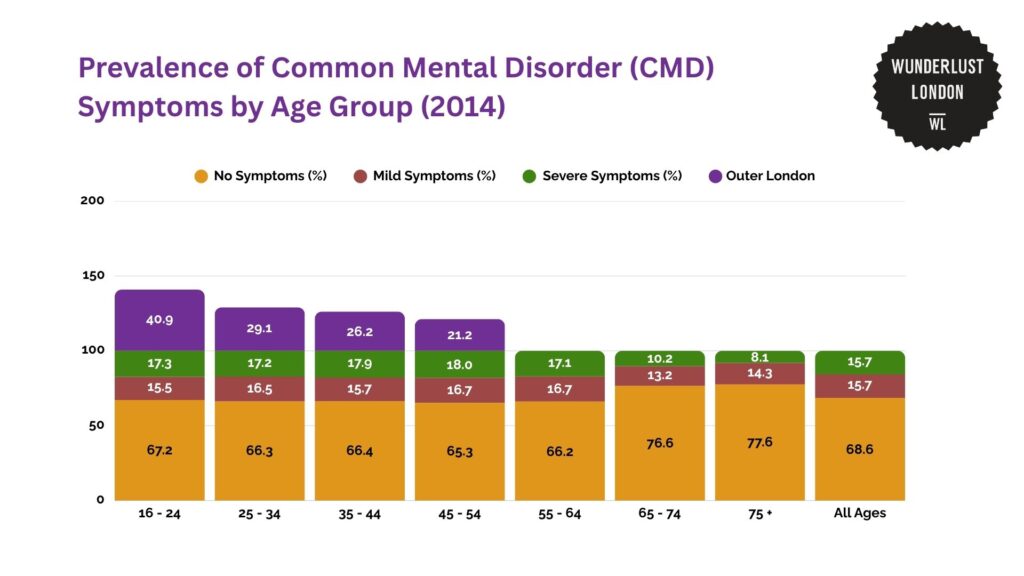
In 2014, the Adult Psychiatric Morbidity Survey reported that mental health symptoms seem to be more common in younger and middle-aged adults. Severe symptoms peaked in the 45-54 age group.
Around 17-18% of people under 65 experience severe symptoms, while this drops significantly in older adults. At the same time, the percentage of people with no symptoms is lower in working-age adults but much higher in those over 65.
One possible reason for this pattern is stress. People in their 20s to 50s juggle work, financial responsibilities, and personal challenges, which could all take a toll on mental health.
Older adults, especially those who are retired, may experience less daily pressure, leading to fewer severe symptoms.
Mild symptoms remain fairly steady across all ages. This suggests that a certain level of mental distress is common at any stage of life, though it doesn’t always escalate into severe issues.
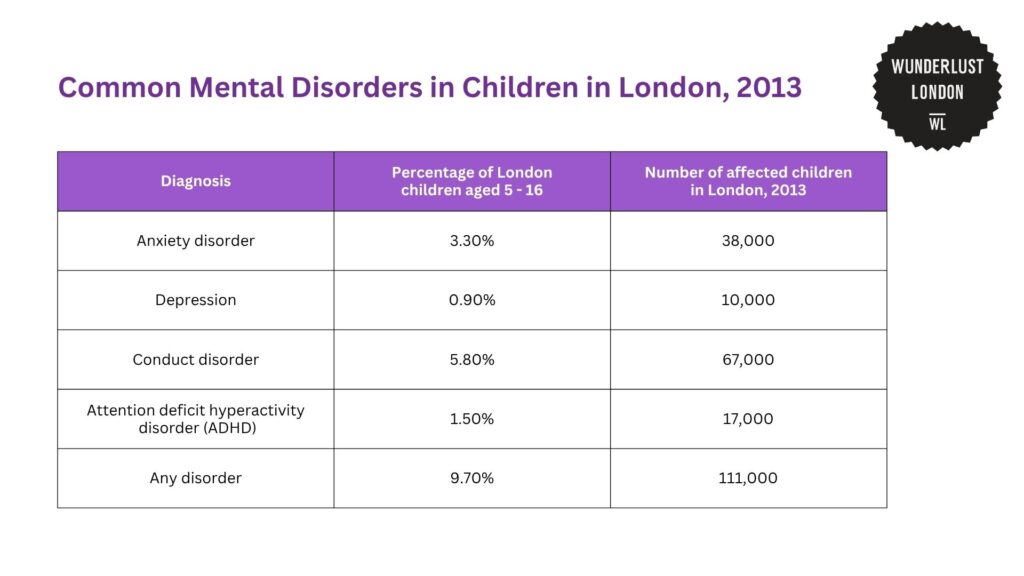
The Greater London Authority provided data about the common mental health conditions among children aged 5 to 16 in London in 2013.
Nearly 10% in this age group had some form of mental health disorder, which is around 111,000 children.
Conduct disorder, which involves behavioral issues like aggression and rule-breaking, was the most common specific diagnosis. It affects 5.8% of children (67,000 in total).
Behavioural disorders, like conduct disorder and ADHD, seem to be more widespread than emotional disorders like depression and anxiety.
Possibly, this is because behavioural issues are often more noticeable and may be diagnosed more frequently. Meanwhile, emotional disorders might go underrreported or be harder to detect.
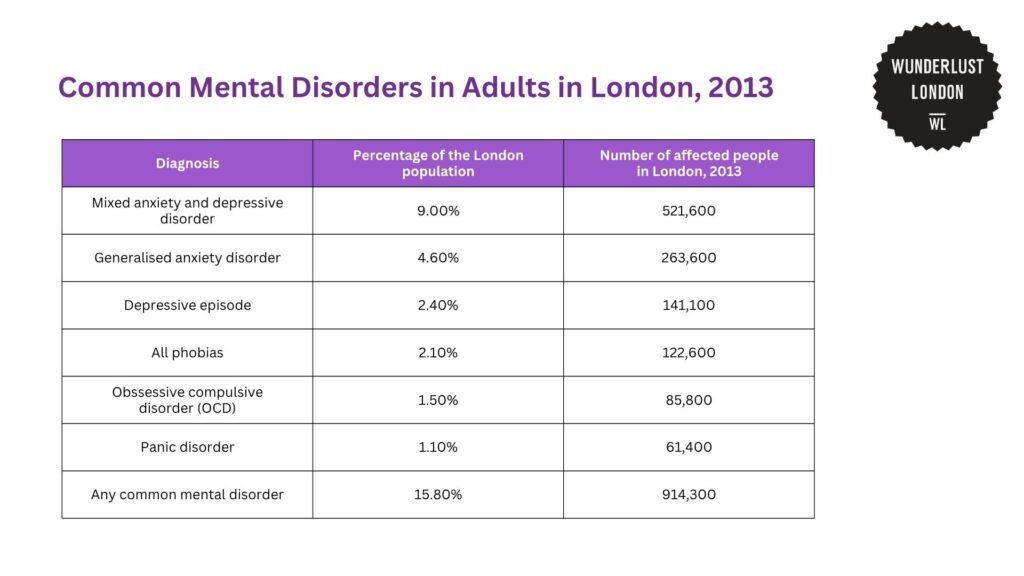
GLA also showed the prevalence of common mental health disorders among adults aged 16 to 64 in London in 2013. 15.8% of the adult population, which is around 914,3000 people, experienced some form of mental health disorder.
The most common condition was mixed anxiety and depressive disorder. This suggests that many adults struggle with both anxiety and depression simultaneously, making it a major concern.
Anxiety-related disorders were the most prevalent, which could reflect the increasing pressures of modern life.
The data also suggests that mental health issues are not isolated cases but affect a large portion of the population.
Mental health disorders in London by gender
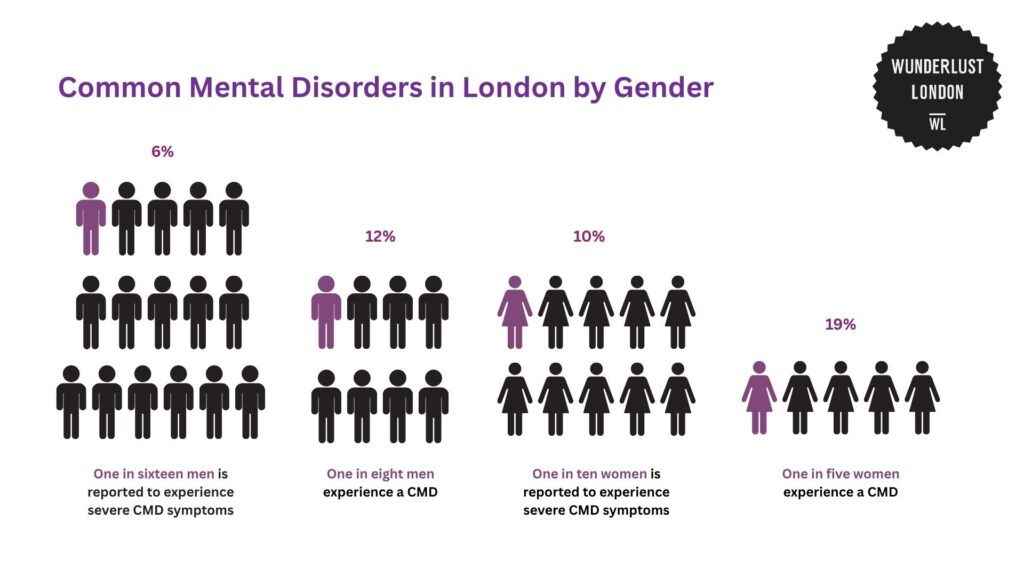
Mental health affects both men and women, but the NHS England data showed that women are more likely to experience common mental disorders than men.
Around one in five women deal with these conditions, while for men, it’s about one in eight. The difference becomes even more noticeable when looking at severe symptoms.
One in ten women report struggling with severe Common Mental Disorders (CMD) symptoms, compared to one in sixteen men.
This doesn’t necessarily mean that men experience fewer struggles. They may just be less likely to report their symptoms or seek help.
Society often places different expectations on men and women when it comes to expressing emotions, which can influence how people handle mental health challenges.
Mental health disorders in London by ethnicity
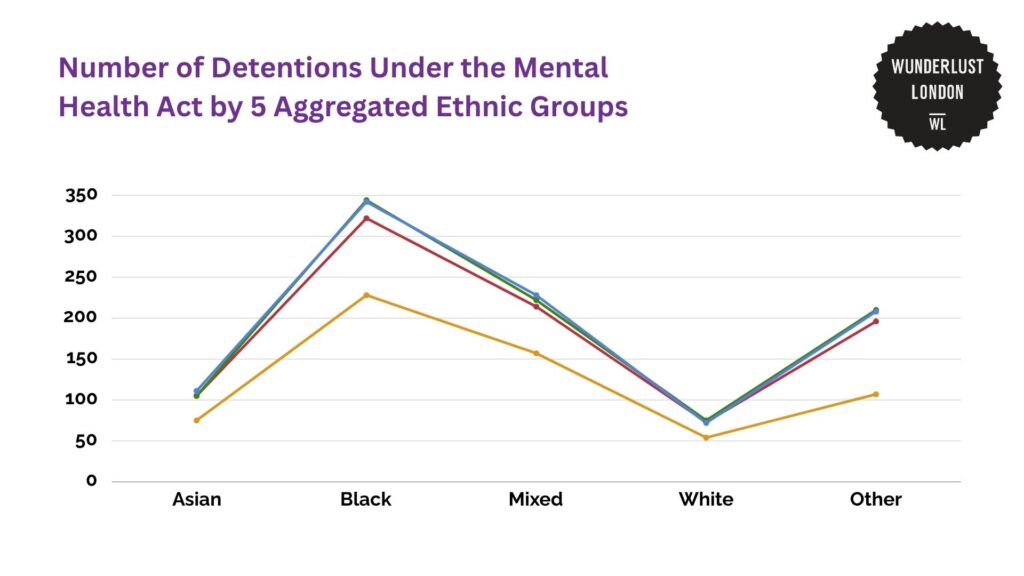
According to GOV.UK, detentions under the Mental Health Act have changed across different ethnic groups over four years.
Black individuals consistently have the highest rates of detention compared to other groups. Although the numbers dropped in 2022/23, they were still higher than other ethnicities.
For most groups, there was either a steady trend or a decline in detentions over time. The White group remained relatively stable but had the lowest detention rates overall.
Interestingly, there is an overall decline in detentions in 2022/23 across all groups. This could be due to changes in mental health policies, better access to community care, or shifts in how detentions are used.
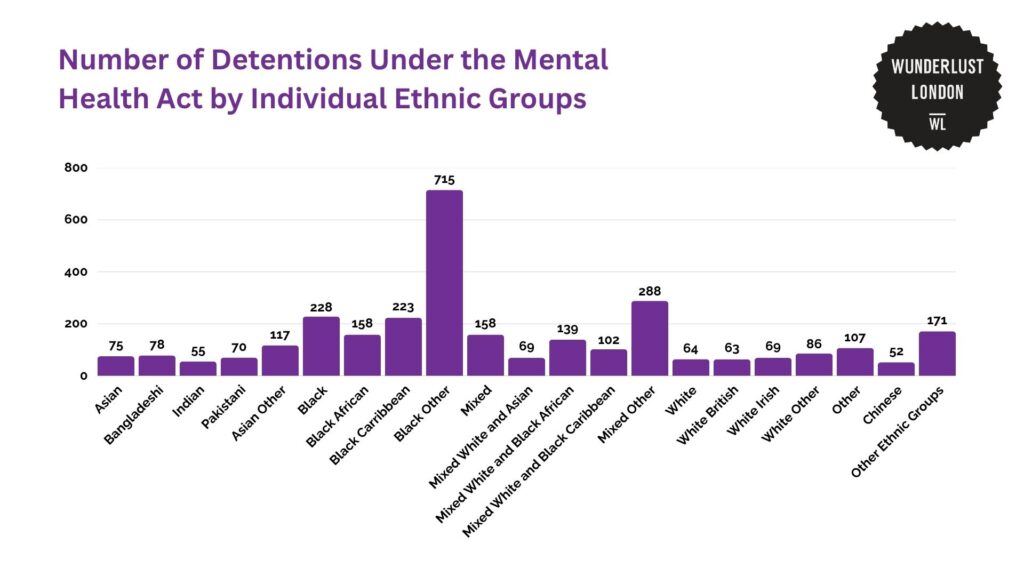
In 2022/23, GOV.UK also showed data on the different ethnic groups detained.
Still, the “black other” category has the highest rate at 715 per 100,000 people, which is significantly higher than other groups. Black Caribbean (223) and Black African (158) communities also have high detention rates.
This data suggests that Black communities, in particular, are more likely to be detained under the Mental Health Act.
This could be due to multiple factors, like differences in access to mental health care, cultural barriers, or systemic issues in how mental health services respond to different communities.
There’s also a trend within larger categories. The “Asian Other” category has a detention rate of 117, which is much higher than that of Indian (55) or Pakistani (70). Similarly, “Mixed Other” (288) has a higher rate than “Mixed White and Asian” (69).
This shows that using broad ethnic labels can hide important differences between smaller groups within the same category.
Economic and social cost of mental ill health in London
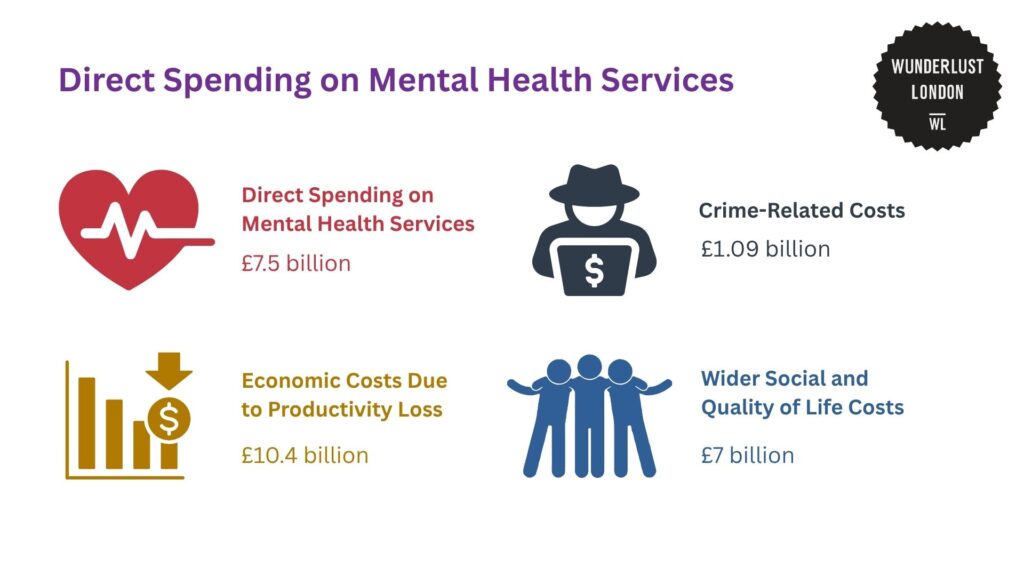
The cost of mental ill health in London is massive, and GLA shared some insights about this.
Economic loss is the biggest financial impact. At £10.4 billion, productivity loss due to mental ill health surpasses direct healthcare costs. Many people struggle to work at full capacity or need time off, which affects businesses and the economy.
Mental health issues create a cycle of additional health problems. The £2.6 billion in extra health costs highlights how untreated mental illnesses contribute to physical conditions. This increases overall medical expenses again.
Informal caregiving is a hidden burden, too. Families and friends providing unpaid care represent a major cost of £1.2 billion. This shows that mental health challenges affect entire households, not just individuals.
There’s also a link between mental health struggles and crime. It may be through encounters with the justice system or the financial impact on victims.
Altogether, the cost of mental ill health in London is more than £26 billion.
Policy interventions to address the mental health challenges in London
To address mental health challenges in London, Thrive LDN was launched in 2018 as a city-wide movement focused on improving the well-being of the city’s residents. It’s supported by the Mayor and led by the London Health Board.
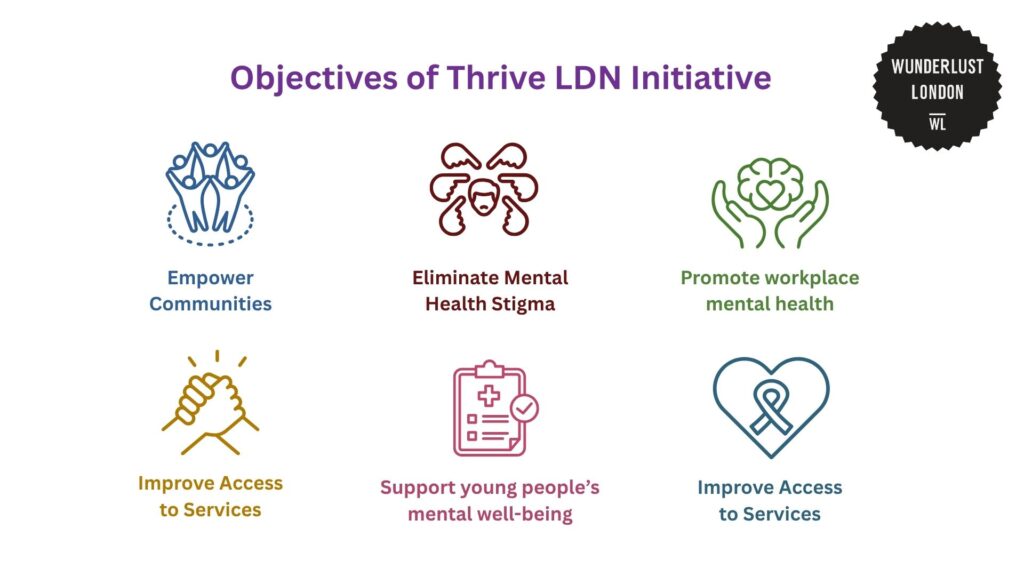
The London Assembly discussed some of the core objectives of this initiative.
One of its focuses is empowering communities, especially the marginalised groups. Programs like Right to Thrive ensure more inclusive and culturally relevant support.
Mental health stigma is still a challenge, so public campaigns help normalise conversations and challenge misconceptions. Partnerships with organisations have encouraged more people to talk openly about their mental health without fear of judgment.
Improving mental health education is another priority. It creates a more supportive environment for children and adolescents in schools and universities.
Workplaces have also integrated policies to provide employee support. Besides promoting Mental Health First Aid training, some organisations have also adopted flexible working conditions to promote well-being.
Thrive LDN also works with National Health Service (NHS) providers and local councils to strengthen mental health support across the city, making services more accessible.
Lastly, it aims to promote suicide prevention training and community outreach programs. It’s designed to help high-risk groups get the support they need.
References
- Adult psychiatric morbidity survey: Survey of Mental Health and Wellbeing, England, 2014. NHS England Digital. (2014). https://files.digital.nhs.uk/excel/9/s/apms-2014-ch-02-tabs.xls
- Association of Public Health Observatories. (2006). Prevalence of common mental health problems, Borough. London Data Store. https://data.london.gov.uk/dataset/prevalence-common-mental-health-problems-borough
- Greater London Authority. (2014). Mental health report. Greater London Authority. https://www.london.gov.uk/sites/default/files/gla_migrate_files_destination/Mental%20health%20report.pdf
- Measuring National Well-being, Personal Well-being in the UK, 2012/13. The National Archives. (2013). https://webarchive.nationalarchives.gov.uk/ukgwa/20160107224519/http://www.ons.gov.uk/ons/publications/re-reference-tables.html?edition=tcm%3A77-313452
- NHS Digital. (2024). Detentions under the mental health act. Ethnicity facts and figures. https://www.ethnicity-facts-figures.service.gov.uk/health/mental-health/detentions-under-the-mental-health-act/latest/
- Supporting mental health for all. London Assembly. (2018). https://www.london.gov.uk/sites/default/files/mentalhealthfinal.pdf